7

New

@ Antonio Vargas - Many thanks - feeling a little foolish!

enter image description here

Old

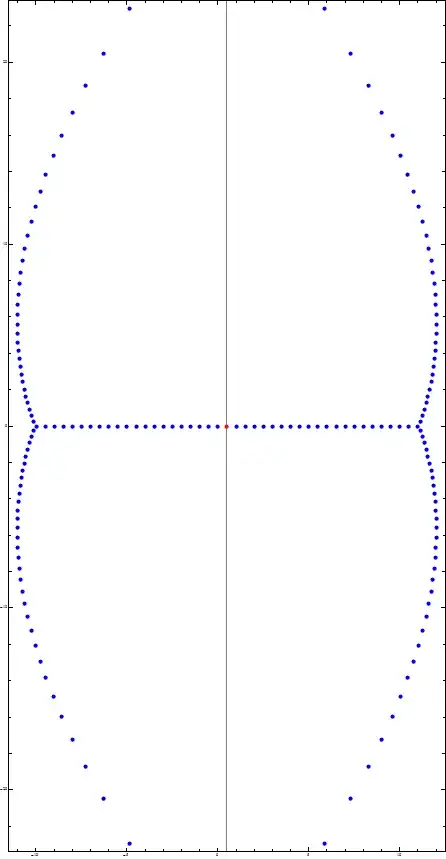
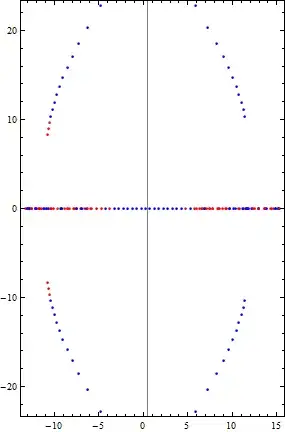
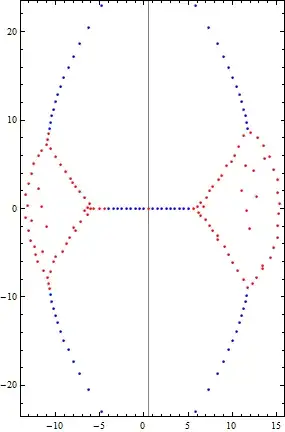
Can anyone point me in the direction of anything that might explain the sudden change in near-symmetrical complex roots of Bernoulli polynomials 170 and 171 (pictured below)? (Symmetric points are marked blue.)

n = 170n = 171

I have looked at previous Math Stack Exchange question: Patterns of the zeros of the Faulhaber polynomials, Wolfram demonstrations Szegö Curve, and John Mangual's paper: Uniform Convergence Behavior of the Bernoulli Polynomials but am not clear on why there seems to be this sudden change in pattern.

martin
  • 8,998

2 Answers2

6

Since at least two people (myself and the asker of this question) have wondered about this at some point, this question will likely be useful to someone else eventually.

This effect is due to numerical error. Try increasing the precision of your calculations.

4

I think your question is very interesting. What software are you using to compute the roots of the Bernoulli polynomials?

I used Maxima. We know that the Bernoulli polynomials are symmetric (for $n$ even) or anti-symmetric (for $n$ odd) around the axis $x=1/2$. This means that the roots are symmetric with respect to the $x=1/2$ axis. Now since the coefficients are real the complex roots are conjugate. Hence we expect symmetry both with respect to both, horizontal and vertical, axes.

Here is the maxima set of instructions:

\begin{verbatim} (%i1) fpprec:128$ (%i2) eqn : bernpoly(x,170)$ (%i3) slns : bfallroots(eqn)$ (%i4) slnlist : map(rhs, slns)$ (%i5) reals : realpart(slnlist)$ (%i6) imag : imagpart(slnlist)$ (%i7) plot2d ( [discrete, reals, imag], [style, points]); \end{verbatim}

Here is the plot:

enter image description here Thanks.

  • @HermanJarramillo Mathematica is software used for image in OP. If you have access to it, try function: bRoots[range_, prec_] := Module[{soln}, soln = Solve[ N[Table[BernoulliB[n, z], {n, range, range}] == 0, prec]]; ListPlot[{Re@z, Im@z} /. soln, AspectRatio -> Automatic, PlotStyle -> {PointSize[Medium]}]] bRoots[range_] := bRoots[range, 100]

    Then compare bRoots[100, 10] and bRoots[100, 100]

    – martin Apr 02 '16 at 16:42
  • @HermanJarramillo I have no idea about Maxima, but it may not be resolution you need to adjust - but the precision of the calculations. – martin Apr 02 '16 at 16:45
  • @martin : The problem was that I though I was using 128 bits precision but I was wrong. I fixed this, and change the plot. Thanks. – Herman Jaramillo Apr 02 '16 at 17:11
  • @HermanJarramillo great - glad you sorted it out :) – martin Apr 02 '16 at 17:42
  • @HermanJarramillo would you mind posing your code in your answer? I think it is always useful to have refs from different languages. – martin Apr 02 '16 at 17:44