2

First of all, I had a look here and in a couple of other questions: I couldn't find what I am looking for.

So my question is purely theoretical (although I have an example by my hands).

Suppose I have some data $(x_i,y_i)$ for $i=1,..,n$. Suppose I fit the following models with IID $\epsilon_i \sim N(0, \sigma^2)$ for $i=1,..,n$

  • $M_1: \log(y_i)= \beta_0+\beta_1x_i+\epsilon_i$
  • $M_2: \log(y_i)= \beta_0+\beta_1x_i+\beta_2x_i^2+\epsilon_i$
  • $M_3: \log(y_i)= \beta_0+\beta_1x_i+\beta_2x_i^2+\beta_3x_i^3+\epsilon_i$

Now I want to see which of these models is better, so I use the following (maybe weird, but stay with me) method, to evaluate their "predictive powers":

  1. Use $(x_i, \log(y_i))$ for $i=1,..,\frac{n}{2}$, to fit $M_1, M_2, M_3$ respectively.
  2. Now use the fitted model (so $M_1, M_2,M_3$ respectively), to predict $y_i$'s using the $x_i$'s from the remaining $\frac{n}{2}$ data , so from $i = \frac{n}{2}+1, .., n$ (careful, predict $y_i$ not $\log(y_i)$)
  3. Use MAE or Mean Absolute Error (here) $MAE = \frac{1}{\frac{n}{2}}\sum_{i=\frac{n}{2}+1}^{n}|y_i-\hat{y}_i|$, being careful that $\hat{y}_i$ is in the original scale of values!

So now my question:

If I do point $1.$ and I fit the three models (hence obtaining estimates for the parameters, their standard errors etc..) and then use these parameters (respectively of course!) to predict the responses of the other $x_i$'s:

  1. Will I be predicting $\log(y_i)$'s right? And this is true... Is it also true that in order to get $\hat{y}_i$'s , instead of $\widehat{\log{(y)}}_i$, I should just take the exponential of those terms? So in general, is it true $\hat{y}_i = e^{\widehat{\log{(y)}}_i}$?
  2. Once I find the three MAE's, how do I judge the models? Should I be looking for the one with smaller MAE?

EDIT

For example suppose I have $1000$ data points. I use the first $500$ to fit model $M_1$. Once I've fitted it, I can predict new values. Hence I predict the new responses of the other $500$ $x_i$'s left. of course, the prediction will be given in logarithmic scale. But I want to calculate MAE on the normal scale.

This is the context of my question, of course I would do this procedure for all the three models and compare the MAEs.
Euler_Salter
  • 5,153

2 Answers2

3

IMO which model is better will depend on many factors.

These include:

  1. Amount of data in each $M_k$
  2. Skewness / spread of the data for each $M_k$ - eg done via box plots.
  3. Plots of errors for each $M_k$ observed vs expected.

These should be done first in my opinion, since the results of these should be used for which seeing which assumptions can be used in each model.

Answering your questions:

Will I be predicting $log(y_i)$'s right?

Yes with what you have wrote.

Is it also true that in order to get $\hat{y_i}$'s , instead of $\widehat{log(y_i)}$, I should just take the exponential of those terms? So in general, is it true $\hat{y_i}=\widehat{e^{\log(y_i)}}$?

Not quite: for example in your first model $M_1$ you define as:

$$\log(y_i)=\beta_0+\beta_1x_i+\epsilon_i$$

Hence $\hat{y_i}=\widehat{e^{\beta_0+\beta_1x_i+\epsilon_i}}$

$=e^{\hat{\beta_0}}e^{\hat{\beta_1}x_i}e^{\hat{\epsilon_i}}$

Once I find the three MAE's, how do I judge the models? Should I be looking for the one with smaller MAE?

Taking the one with the smaller MAE would make sense, however I would take the value of highest $R^2$.

Most importantly to be able to use any of these models, they need to be significant. The way this is measured is typically via p-values. Depending on the hypothesis being tested, from a p-value that is less than eg $0.05$ it can be inferred it is significant.

A small p-value (typically ≤ 0.05) indicates strong evidence against the null hypothesis, so you reject the null hypothesis.

http://www.dummies.com/education/math/statistics/what-a-p-value-tells-you-about-statistical-data/

  • Thank you for your great answer! However I think none of you two actually understood half of the question, my bad. The data is the same for both models! I have some data, I want to test 3 models, on the same data! – Euler_Salter Apr 18 '17 at 18:20
  • Regarding the second yellow box you wrote: then if I use $R$ to do my calculations and I fit those three models, then I will get fitted values of the logarithm, i.e. I will get $\widehat{\log{(y_i)}}$. So my question is: once I get these outputs from $R$, how do I find the actual fitted values $\hat{y}_I$? What should I do in order to find the fitted values in the original scale? – Euler_Salter Apr 18 '17 at 18:23
  • I am not familiar with the software $R$, however if you have a significant model, and have $\beta_0$, $\beta_1$, $\epsilon$, then for each $x_i$ you can calculate corresponding $\hat{y_i}$ by using formula I gave in my answer. – unseen_rider Apr 19 '17 at 16:24
1

@unseen_rider provides a great answer. This post forwards mathematical questions which may be relevant.

Part of the theme regards the dangers of logarithmic transforms. An example of how this affects the $L_{2}$ minimization problem is in Linearize $y=c+ax^b$.

But certainly, for a given $a$, $$ \big| y_{k} - a_{0} e^{a_{1}x} \big| \ne \big| \ln y_{k} - \ln a_{0} - a_{1}x \big| $$

Input

A sequence of $m$ measurements $\left\{ x_{k}, y_{k} \right\}_{k=1}^{m}$.

Models

Switching to natural logarithms as a personal choice, the models are a sequence like $$ \begin{align} y_{1} (x) &= a_{0} e^{a_{1}x} \\ % y_{2} (x) &= a_{0} e^{a_{1}x+a_{2}x^{2}} \\ % y_{3} (x) &= a_{0} e^{a_{1}x + a_{2}x^{2} + a_{3} x^{3}} \\ % \end{align} $$ The problem is to find the best solution vector in the $L_{1}$ norm.

Solution

Transformation distorts problem

As noted in the earlier post, true logarithmic transformation doesn't deliver a linear problem. It simply distorts the problem. The logarithmic form seems to hide this flaw in plain view. Colloquially, the logarithmic transformation provides an easy path to a point which is not the solution.

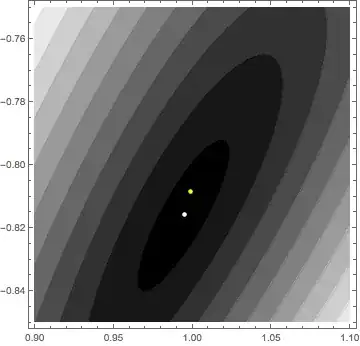
If we can get a data set, we can quantify this point. Until then, here is an $L_{2}$ example. The white dot is the true minimum, the true least squares solution. The yellow is the solution to the logarithmically transformed data set.

White and yellow

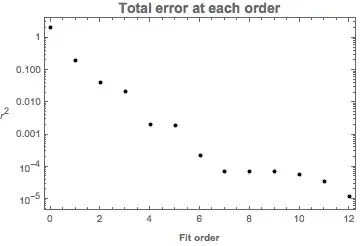
Increasing order of fit

You pose a merit function, a definition of the error, which you want to minimize. In general, more fit parameters will give a better answer, up to a point. An example is in Polynomial best fit line for very large values

Typical results for fits with polynomials of increasing fit order in $L_{2}$.

L2

dantopa
  • 10,342