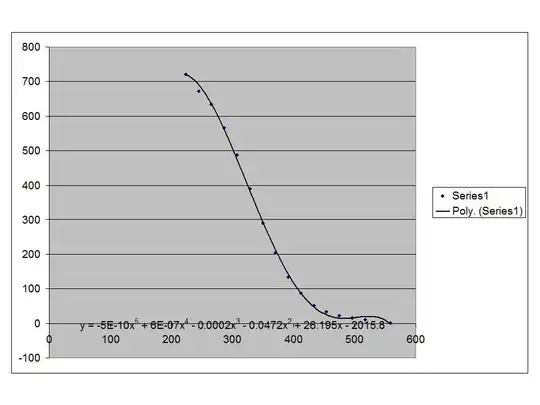
not only are the x values large, the difference between them and the y values is huge. My data points:
$22353120,720$
$24448725,671.427053270323$
$26544330,634.312274868634$
$28639935,566.291966792026$
$30735540,488.299713935616$
$32831145,390.448846935$
$34926750,290.41154091049$
$37022355,204.641148591763$
$39117960,134.468462627021$
$41213565,86.405526235728$
$43309170,51.28276608$
$45404775,34.1174965089024$
$47500380,21.4393552344576$
$49595985,16.058562926011$
$51691590,10.32615461376$
$55882800,0.461961425407946$
The only nice pair there is the first one, and it MUST be produced by the equation, whatever it is. I've tried Wolfram Alpha and Excel to plot them and create a regression line, but neither of them can handle the large numbers or something. Wolfram just says it can't do anything with it, and Excel only generates a binomial equation (even when I select a higher order one) that isn't anywhere near correct. Is there any way to do this?