45

I am a mathematician by training working with a physicist. I have been invited to give an hour-long tutorial/presentation to incoming graduate students. These students are all coming in with physical sciences backgrounds and proceeding on with physical sciences like physics, chemistry, atmospheric physics, astronomy, etc.

One of the things I have always been surprised at is how callous come scientists can be with using mathematical results/ideas/theorems without fully understanding the assumptions required and then misapplying the result/idea/theorem and then also misinterpreting the results.

Two of my favorite examples are

  1. When fitting to a power law, convert the data to log-log and fit a straight line. This is just plain wrong because for least squares fitting, we assume the error to be normally distributed. In log-log space we get log-normal distribution of error. And it isn't that difficult to built an example which will show wildly different answers. This one is actively taught in the classrooms/labs.

  2. Misunderstanding $p$-values, how to generate them and understand them. I have seen people using Excel/MATLAB and just using the pull-down menus and doing statistical test after test without any true understanding of how/when to apply the test and then reporting 50 $p$-values "answering" 50 different questions on the same data set and then publishing them.

So my question is to this community, what kind of common math mistakes have you seen scientists do? What are some common misconceptions or misapplications have you seen scientists do that just make you cringe as a mathematician? I thought this would be a good topic to talk about with potential researchers and I just want to have a good pool of topics to talk about for an hour. In addition, if you have an example, then if you can point me to some good literature (paper/book/website) showing perhaps a proof and/or examples which I can demonstrate, that would be wonderful.

I hope this soft-question is not inappropriate here. Thanks.
Shaun
  • 44,997
Fixed Point
  • 7,909
  • 3
  • 31
  • 48
  • 2
    When dealing with terms that look like $\frac{1}{n} \sum_{i=1}^n X_i$, scientists often assume that this sum is actually normally distributed for all computations. For nice enough random variables his is a reasonable approximation in the bulk, but only in the bulk. It is wildly incorrect for moderate or large deviations from the expected value. – Chris Janjigian Nov 21 '13 at 22:53
  • differentiate under the integral sign, sum (in particular outside the radius of convergence) whatever in cases where you obviously cannot do this. – Alexander Grothendieck Nov 21 '13 at 22:59
  • 14
    $$\Large\frac{dx}{dy}=\frac xy$$ – Asaf Karagila Nov 21 '13 at 22:59
  • 29
    Q: How do you find a math error in an economics paper? A: Point to an arbitrarily chosen equation. – Emily Nov 21 '13 at 23:01
  • 2
    Freshman dream of differentiatng fractions. Physicists blindly applying Fubini's Theorem to interchange limits of integration. Economists who say that a 10% error on a calculated value of 100 is (95, 105). – Calvin Lin Nov 21 '13 at 23:09
  • 3
    We can tell you about mistakes made, but i think you need a pool of answers from scientists about mathematical mistakes (perhaps made by them) that mattered to them, and why. If you talk for an hour about what they OUGHT to care about you will not really engage their interest. – Will Jagy Nov 21 '13 at 23:11
  • 1
    @WillJagy I completely agree with you but didn't want to crosspost in physics or something yet. First I thought I would hear the opinions here. My two examples above I think are pretty important and the scientists themselves will care if explained to them. At least the power law fitting example is important because everyone wants to find the scaling exponent of something or the other. I am just waiting to see what people here have to say. Thanks. – Fixed Point Nov 21 '13 at 23:16
  • In my experience the vast majority of professional scientists understand quite well the mathematics needed for whatever they're doing, and in that sense there are no common mistakes. – TBrendle Nov 21 '13 at 23:18
  • Assuming that math formulae hold numerically, and then getting confronted with cancellations of significant digits. I have plotted some beautiful artefacts, but these are of a purely mathematical sort. – ccorn Nov 21 '13 at 23:43
  • I don't understand your first favorite example: If you suspect a growth of the form $x^{\alpha}$ and if you would like to get an idea about what $\alpha$ is, one way to do is to draw a log-log graph and see what its slope is. – Lord Soth Nov 21 '13 at 23:48
  • @LordSoth True that the slope of the straight line in log-log space is the scaling exponent. But approximating it using linear least-squares by fitting a straight line in log-log space is wrong. Using LLSF in log-log space can give you a wrong (biased) answer. – Fixed Point Nov 21 '13 at 23:53
  • @ccorn Is it possible to post some here in an answer perhaps? I would be interested in seeing them. Thanks. – Fixed Point Nov 21 '13 at 23:54
  • You might post on the statistics site – Will Jagy Nov 21 '13 at 23:55
  • Using methods that assume euclidean metric in arbitrarily composed configuration spaces without matching norm or inner product. For example, using discretized cartesian laplace operators in HSB color space and wondering why the interpolated values get outside the convex hull. – ccorn Nov 22 '13 at 00:15
  • expand the subject pool a bit, http://math.stackexchange.com/questions/260656/cant-argue-with-success-looking-for-bad-math-that-gets-away-with-it/260662#260662 – Will Jagy Nov 22 '13 at 02:36
  • 1
    @FixedPoint: Re: your log-log example, surely that depends on what you assume your error terms look like. If your error terms are approximately log-normal (e.g. because they're the product of many small multiplicative errors), LLSQ in log-log space is appropriate; if they're normal (e.g. because you have many small additive errors), you should do NLSQ in linear space. Of course, if your errors are small enough, both approximations could be good; conversely, it's quite possible to have errors that are neither normal nor log-normal. (Quantization errors are one notable source of these.) – Ilmari Karonen Nov 22 '13 at 06:03
  • You may be mathematically correct about fitting a least squares fit to a power law distribution, but giving extra weight to the smaller magnitude points is in fact useful in many cases. Giving a least squares fit to the actual experimental data as you suggest (rather than the log log plot) will give similar absolute errors to the smaller magnitude points as it does to the larger ones, which may turn out to be massive % errors. The mistake made by the scientists is not in their technique, but rather in how they describe it mathematically. – Level River St Jan 09 '16 at 16:55

3 Answers3

14

Assuming that math formulae hold numerically, and then getting confronted with cancellations of significant digits. For the sake of its strange regularity, I'd like to present an example produced by my own naivity.

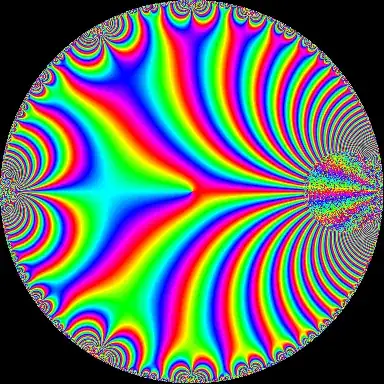
Fig. (a) below shows a phase plot of the (normalized) modular discriminant $$\Delta(q) = q\prod_{n=1}^\infty(1-q^n)^{24}\quad\text{for}\quad |q|<1$$ over $q$ in the complex unit disk. You will notice Moiré effects, but these are not the artefacts I am going to discuss here.

Note that $\Delta(q^2)$ can be expressed in terms of Jacobi Thetanull functions: $$\Delta(q^2) = 2^{-8} \vartheta_2^8(q)\,\vartheta_3^8(q)\,\vartheta_4^8(q)$$ These are related by Jacobi's Vierergleichung $$\vartheta_3^4(q) = \vartheta_2^4(q) + \vartheta_4^4(q)$$ The silly idea was to use the Vierergleichung to eliminate $\vartheta_4^4(q)$, giving $$\Delta(q^2) = \left(2^{-4} \vartheta_2^4(q)\,\vartheta_3^4(q) \left(\vartheta_3^4(q)-\vartheta_2^4(q)\right)\right)^2\tag{*}$$

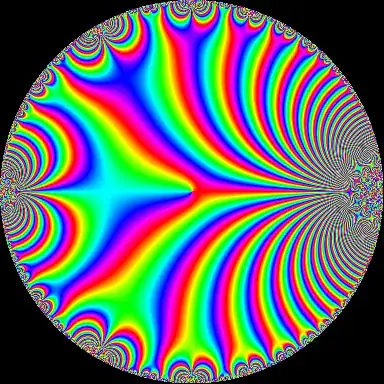
Problem is that as $q\to1$, the Thetanull $\vartheta_4(q)\to0$ whereas the other two Thetanulls grow unbounded. Thus (*) uses an ever-smaller difference of two ever-larger complex values and soon looses all numeric accuracy. The result, computed with IEEE-754 double precision arithmetic, is shown in Fig. (b) below. Some of the artefact's features can be easily understood, others are still a mystery to me. Larger resolutions are available on request.

(a) Phase plot of $\Delta(q)$ as it should be (b) Phase plot with artefact

ccorn
  • 9,803
12

The assumption that if $X$ is a distribution with "desired properties" then so is $f(X)$. Here the "desired properties" may mean something like "uniform on interval [0,1]" and $f(x)$ is often something like $x^2$.

The tendency to invert a matrix to solve a linear system. In particular, "why MATLAB blew up memory" complaint is often caused by the assumption that the inverse of a sparse matrix is also sparse.

The lack of appreciation of the magnitude of accumulated rounding errors, implicit in the assumption that numerical solutions are "accurate enough". This famously caused 28 casualties when Patriot missile missed the target due to round-off accumulation.

Michael
  • 1,649
  • 10
  • 16
8

That a 95 % confidence interval can be interpreted as "the probability that $\theta$ is in the interval is 95%". With a frequentist approach, it's either 0 or 1, and instead we use the (somewhat vague) interpretation of confidence. But many people don't know, or get, this.

hejseb
  • 4,745
  • 1
  • 17
  • 35
  • I'm curious to know why someone downvoted this. It is a common mistake so I think it's appropriate here. If you disagree, please explain why. – hejseb Nov 22 '13 at 13:54
  • I didn't downvote, but some authors define a confidence interval as a random interval instead of its realisation. In this case the said statement is true. – user1551 Nov 23 '13 at 06:33