2

I have been scouring the internet trying to figure out how Riemann surfaces work, and I found two different explanations of them. The first visualizing the surface by plotting the real part(or imaginary) of the function defined over $\mathbb{C}$ as the height above the plane and the second involves a procedure of gluing sheets

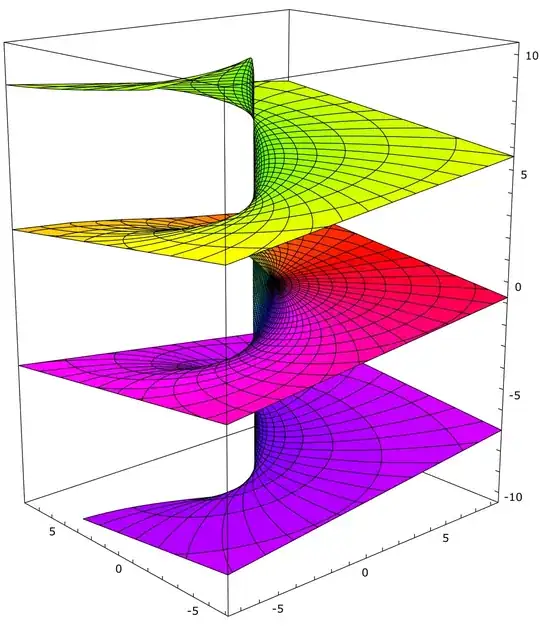
The gluing planes, I find it difficult to explain the idea in generality, but I will try with the example for $w=\log z = \log r + i \theta$, we know that each time spin about the a circle in the input plane, we get a different value of $\omega$. Eg:

$$ w(re^{i\theta}) = \log r + i (\theta)$$

$$ w ( re^{i \theta + 2 \pi} = r e^{i \theta} ) = \log r + i ( \theta + 2 \pi)$$

Now to fix this issue of the same input point giving multiple value, we take two copy of $Z$ plane, and cut a line from origin (the branch point) to infinity. One each sheet we have an edge above the cut and below the cut. Join the the bottom edge of the first sheet with the top edge of the second sheet, repeat this iteratively , we get the Riemann surface which is suppose to represent the true domain of $\log z$

The second construction makes more sense to make because it should be that we can embed in the Riemann surface into 3D as it's fundamentally a two dimensional surface ( requires only two parameters to describe $(r, \theta) $).

Returning to the question: How exactly is this second construction of sheet gluing related to the first construction involving plotting the real part as height above plane? What advantage does the first have over the second?


BTW I will appreciate resources/ references to understanding Riemann surfaces in comments. Here are some things I found helpful:

  1. Reading Feynman Blog
  2. Roger Penrose Road to Reality (Yes the book has a chapter just for this which explains the actual philosophy behind Riemann surfaces)
  3. Berkeley mathematician's explanation of Riemann surfaces (I don't fully understand this as the language in it is beyond the level of rigour I currently can understand)
  • I suggest you state what is your math level. It might be that you are simply not ready to read about Riemann surfaces. If I were you, I would try to fully understand (3). Likely, it will require some knowledge of general topology that you are currently lacking. – Moishe Kohan Jan 03 '22 at 09:20
  • 1
    I don't understand the question. Isn't the "gluing planes" image in your profile the same thing as plotting all possible imaginary parts of the multivalued logarithm? Is that not what you meant by one or both of the things you would like compared? – Mark S. Jan 03 '22 at 10:03
  • Hmm I mean, my understanding of complex analysis and differential geometry is from tristan Needham's books.. I mostly have an engineering like background because I've never read an analysis text till date (started with terrance tao's book tho) @MoisheKohan – tryst with freedom Jan 03 '22 at 12:04
  • I don't think it is the same since the structure in my profile picture, it contains both the value of the real and imaginary part, like each sheet which is twister around has each poitn on it representing a real and imaginary part @MarkS. – tryst with freedom Jan 03 '22 at 12:05
  • Possibly of interest: log and sqrt. – Andrew D. Hwang Jan 03 '22 at 15:06
  • Neither one of these two descriptions passes the smell test. However, to relate the two, you should take into account the fact that for the first description you have to plot not only the real part but also the imaginary part. Together, they give you a better idea of the actual function. My suggestion is to read (3). – Moishe Kohan Jan 04 '22 at 00:56
  • What is the smell test?@MoisheKohan – tryst with freedom Jan 04 '22 at 07:17
  • See Wikitionary's definition 1 for the relevant definition of "smell test". – Mark S. Jan 04 '22 at 12:41

1 Answers1

0

From the most recent comment, I think Buraian almost already understands the relationship. The Riemann surface would be (or at least would be embeddable as) a collection of pairs of complex points $(z,w)$ representing inputs and reachable/possible outputs.

But since we don't often make plots with 4 real dimensions, we would have to do something to cut it down to 3 for visualization. For example, in the case of the Riemann surface for the multivalued complex logarithm, we might omit the real part of $w$, to come up with something like this graph by Leonid 2: vertical spiral

This is actually clarified by the image author in the description on Wikimedia:

Riemann surface of Log[z], projection from 4dim C x C to 3dim C x Im(C)

Mark S.
  • 23,925
  • Hmm I feel you haven't understood my question.. – tryst with freedom Jan 03 '22 at 15:41
  • @Buraian I was worried about the same. Maybe my confusion can help you clarify your question (e.g. you could say why this doesn't answer it) and then I/someone else might be able to answer then. – Mark S. Jan 03 '22 at 17:21