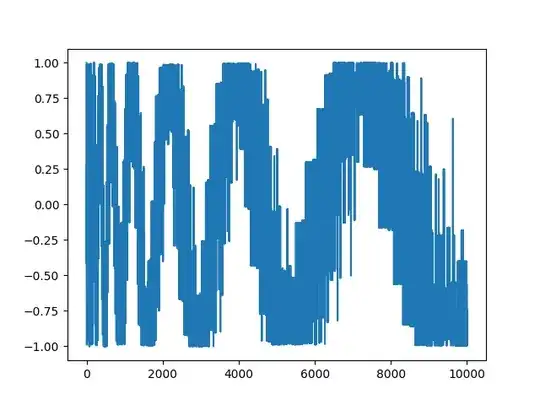
Some commenters were concerned with the lack of intermediate points. Here's a plot with all values up to 10000. I think there's definitely something going on here.

Interestingly, $\cos(S(i))$ itself has a strong cosine shape.
Code:
import numpy as np
import matplotlib.pyplot as plt
N = 10000
mem_S = {1:0}
def S(n):
    if n in mem_S:
        return mem_S[n]
    if n % 2 == 0:
        ans = S(n//2) + 1
    else:
        ans = S(3*n + 1) + 1
    return ans
n = np.arange(1, N+1)
S = np.array([S(n) for n in range(1, N+1)])
cos_S = np.cos(S)
sum_cos_S = np.cumsum(cos_S)
plt.plot(n, sum_cos_S)
plt.show()
plt.plot(n, cos_S)
plt.show()
Edit: I have a much better idea of what's going on now. Long story short, this pattern happens because of a numerical coincidence:
$$
2\pi\frac{\log 2 - \frac{1}{3}\log 6}{\frac{1}{3}\log 6} = 1.0088... \approx 1
$$
For plot 2 above, we can see that $\cos(S(n))$ seems to look "on average" like $\cos(b\log n)$. So the nice looking wave we get for $\Sigma_m^n \cos(S(m))$ just comes from the sum averaging out the noise in $\cos(S(n))$.
The question is why $\cos(S(n))$ seems to look so much like $\cos (b \log n)$ for some $b$.
Here's the plot that answers that question. ($n$ goes up to 100000 in this plot):
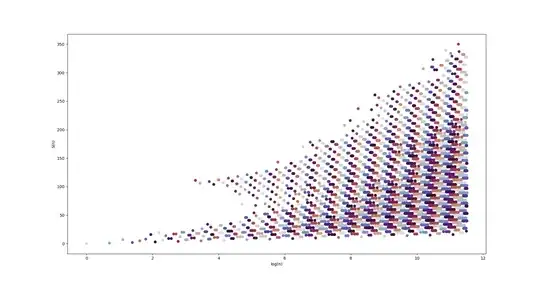
The individual points are coloured according to $e^{iS(n)}$. (Command to plot is plt.scatter(np.log(n), S, c=(S % (2*np.pi)), cmap="twilight"))
The first thing to notice is that the points clump up into clusters, and those clusters are organized into a lattice. I have a rough explanation for the existence of the lattice, although the fact that it's so neat and orderly still surprises me. The rough explanation is that for large numbers, the $+1$ in $3n+1$ is tiny compared to the overall size of the number. So generally, we can expect that a $3n+1$ step is more or less like adding $\log 3$ onto $\log n$ and an $n/2$ step is like subtracting $\log 2$. Getting from $n$ to 1 on a linear scale means getting from $\log n$ to 0 on a log scale. So the points of the lattice are given by $(a \log 2 - b \log 3, a+b)$ for integers $a,b$, and the small $+1$ errors create a spread out cluster of points around each lattice point.
Now that the lattice is explained, the next question is why there are vertical stripes of colour, corresponding to $e^{iS(n)}$. It was perfectly possible that these stripes not be vertical, but some other angle. That would cause the pattern to be destroyed by destructive interference.
The lattice basis vectors given by the expression above are $(\log 2, 1)$ and $(-\log 3, 1)$. We can change basis to replace $(-\log 3, 1)$ with $(\log 2 + \log 3, 0) = (\log 6, 0)$. The $S(n)$ component of this vector is 0, so lattice points separated by this vector all have the same value of $S(n)$, and thus the same value of $e^{iS(n)}$.
So the pattern must have $\log 6$ periodicity along the $\log n$ axis. But in fact, the wavelength we observe is $\frac{1}{3} \log 6$, a special case of $\log 6$ periodicity.
We can now use the remaining basis vector, $(\log 2, 1)$ to check if the stripes are vertical. Incrementing $S(n)$ changes the phase $e^{iS(n)}$ by a factor of $e^i$. If the stripes are vertical, then adding $\log 2$ to $\log n$ should change the phase by $e^{2\pi i \log 2 / \frac{1}{3}\log 6}$. Since,
$$
2\pi\frac{\log 2 - \frac{1}{3}\log 6}{\frac{1}{3}\log 6} = 1.0088... \approx 1
$$
these phase differences are approximately equal, as expected. This implies the stripes are indeed approximately vertical. We could get exactly vertical stripes by scaling $S(n)$ very slightly before applying the cosine. Without this correction, the formula will eventually fail for large $n$. This method also gives a value for $b$, being $2\pi$ over the wavelength:
$$
b = \frac{6\pi}{\log 6} = 10.5201...
$$


