I'm struggling with a discrepancy that Wolfram and Maple are giving me. To make everything comprehensible, I describe in the following what I did step by step.
When I let Wolfram calculate the Fourier Transform of the function:
$$H(z)=\sqrt{\frac{2}{\pi z}}e^{i \left(z-\frac{\pi}{4}\right)}$$
by using H[z_]:=Sqrt[2/(Pi*z)]*E^(I(z-Pi/4)); FourierTransform[H[z],z,w], I obtain:
$$ \frac{(1+i) e^{-\frac{1}{4} (i \pi )} (\text{sgn}(w+1)+1)}{\sqrt{2 \pi } \sqrt{\left| w+1\right| }} $$
But when I use Matlab with the following code:
syms x v A w;
% We make the following substitutions:
% A=sqrt(2/pi) and
f = A/sqrt(x) * exp(i*(x-pi/4));
f_FT = fourier(f)
then Matlab yields f_FT=(2^(1/2)*(-1i)^(1/2)*A*pi^(1/2)*(sign(w-1)+1)*(1/2-1i/2))/abs(w-1)^(1/2) which after resubstitution of my variable $A$ leads to:
$$ \frac{2\sqrt{-i}\cdot(\text{sgn}(w+1)+1)\cdot\left(\frac{1}{2}-\frac{i}{2}\right)}{\sqrt{\left| w+1\right| }} $$
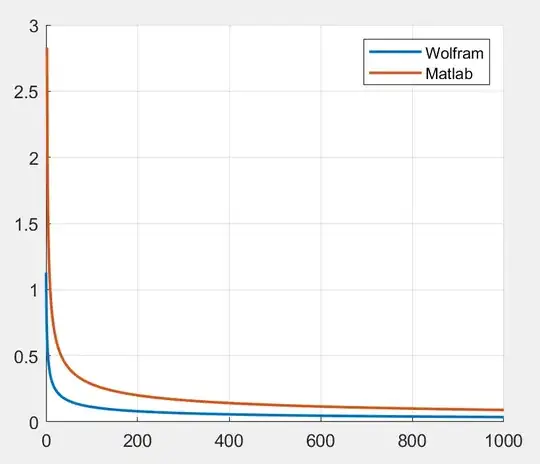
Plotting both results using
w = 0:1:1000;
H1 = ((1+i)*exp(-i*pi/4).*(sign(w+1)+1))./(sqrt(2*pi).*sqrt(abs(w+1)));
H2 = (2*sqrt(-i).*(sign(w-1)+1)).*(1/2-i/2)./(sqrt(abs(w-1)));
figure; hold on;
plot(w, abs(H1), 'LineWidth', 1.5);
plot(w, abs(H2), 'LineWidth', 1.5);
xlim([0 1000])
ylim([0 3])
legend('Wolfram', 'Matlab'); grid on;
lead to the following chart:
Why we have such a kind of discrepancy?
Remark (inspired by Steven Clark):
Dividing the result that I obtained from Matlab by $\sqrt{2\pi}$ and when I accordingly define H2 = (2*sqrt(-i).*(sign(w-1)+1)).*(1/2-i/2)./(sqrt(2*pi).*sqrt(abs(w-1))), then both charts are graphically identical:

