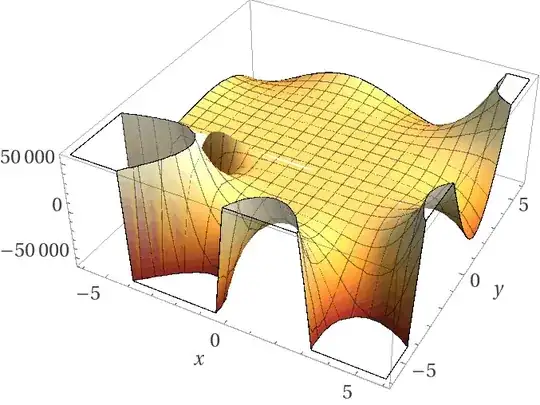
Inspired from:
"The Egg:" Bizarre behavior of the roots of a family of polynomials.
And much more information is at:
Wolfram Functions 3D plots over the complex planes for $z^a$
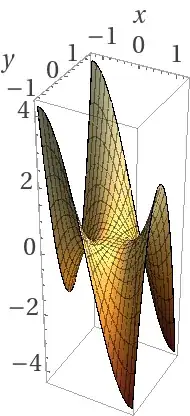
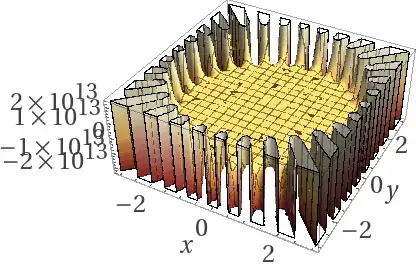
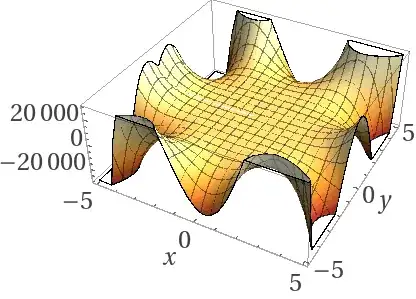
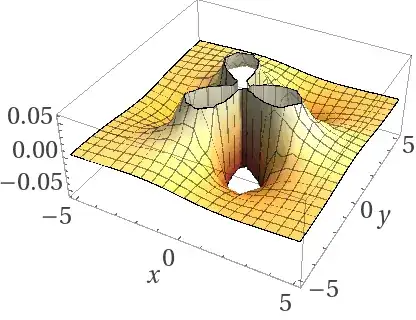
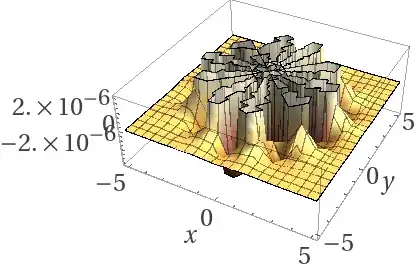
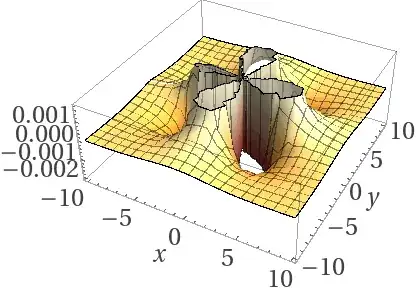
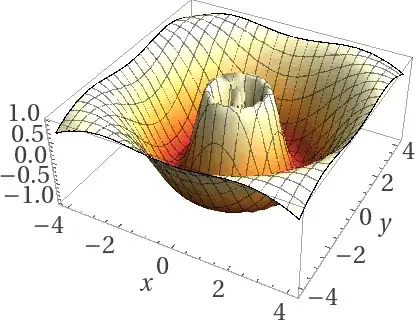
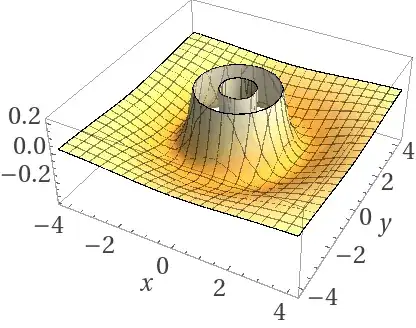
I came to notice that a surface plot of $$z=(x+yi)^n$$ had a saddle or a singularity made n lines of symmetry from the origin. Here are a few plots of the real part for simplicity:
Positive n: Notice the “saddle” shape and n lines of symmetry:
$n=3$:
$n=30$:
$n=2\pi$:
Negative n Notice the essential singularity at x=y=0 and n lines of symmetry:
$n=-3$:
$n=-10$:
$n=-3.7$:
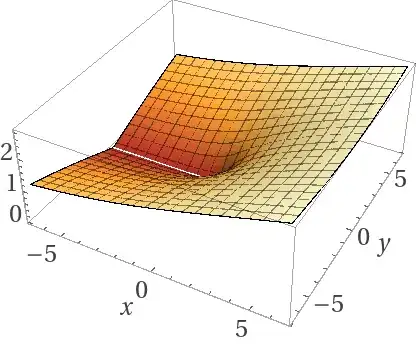
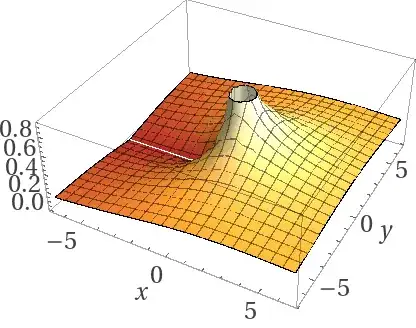
$|n|<1$:: The closer to 0 the fraction is, the more circular the plot looks. The closer to 1 that n is, then the more it looks like a plane. A similar concept applies for $1<n<2$ and $-2<n<1$:
$n=\frac12$:
$n=-\frac12$:
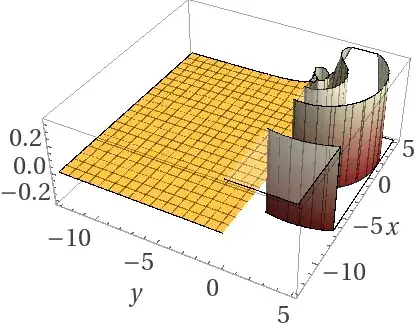
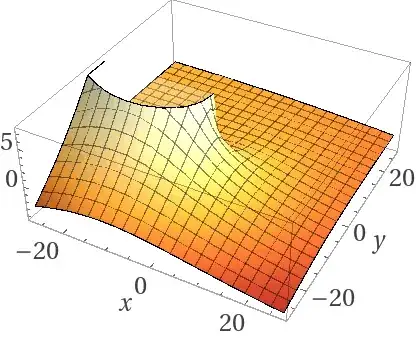
Complex n: There seems to be no clear pattern other than a complex amount of “lines of symmetry”. We can also use De Moivre’s formula to split z into real and imaginary parts. Notice the oscillation:
$n=4i$:
$n=-2-3i$:
$n=-1-4i$:
$n=\frac1e-\frac1{\sqrt2}i:$
I already have some observations, but I would like to know what a graph of $$z=(x+yi)^n$$ would look like for a given n. For example, why does each bigger value of $|n|\in\Bbb R$ add more lines of symmetry and why does $n\in\Bbb C$ have such peculiar oscillatory behavior? I am guessing it has to do with the Riemann Surfaces of $z^n$. Also note that the argument of z will give insights as well. Please correct me and give me feedback!
The mystery of the symmetry has been solved by @Thomas Andrews, but behavior for complex and imaginary is still an open problem. If you have a better proof for real n than @Thomas Andrews, then please feel free to write it.
