0

A lot of functions are defined on the complex plane, like the Gamma function:

enter image description here

the Lambert W function,

enter image description here

etc.

But I have no idea about what the complex plane means and how it's useful, or just how they graph it. If someone has an idea, please tell me about it. Thanks to all.

Zev Chonoles
  • 129,973
mnsh
  • 5,875

2 Answers2

2

The complex plane is a two-dimensional generalization of the real numbers. Complex numbers (a, b) are added just like you'd expect: (a, b) + (c, d) = (a + c, b + d). They multiply a bit differently, though: (a, b)(c, d) = (ac - bd, ad + bc). You can get ordinary real numbers back by setting the second number of the pair to 0.

Usually (a, b) is written $a+bi$, with the understanding that $i$ is not a real number. In fact it acts as a square root of $-1$, which does not exist in the real numbers. You can see this as so: (0, 1)(0, 1) = (0-1, 0+0) = (-1, 0) or $-1+0i.$
Charles
  • 32,122
  • thanks alot but what is the different colours mean we see red,green,blue,etc. – mnsh May 20 '13 at 20:11
  • 1
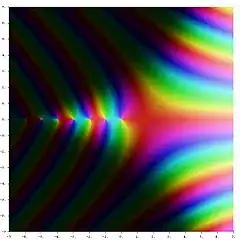
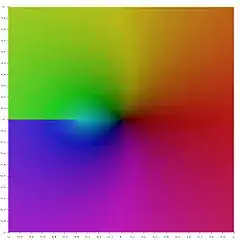
    @hmedan.mnsh: So you're using both x and y to give the input number and you still need to represent the output number somehow. Rather than extend the graph with one or two more dimensions these graphs were colored to denote the value of the output -- in this case, probably the absolute value of the functions indicated. The absolute value of (a, b) is $\sqrt{a^2 +b^2}.$ – Charles May 20 '13 at 20:14
  • 2
  • @Charles: I don't know about complex plane I mean about those photos so I searched about that and now i'm under stand, those photos are contour plot so the question What is exactly the contour plot, and how is it useful? – mnsh May 21 '13 at 09:25
1

The complex plane is simply an x-y grid, where the x axis is the reals, and the y axis is the complex number $\sqrt{-1}$. What makes this sort of representation is that rotation around the centre is a multiplication, and thus the re-scaling and rotation required to bring $(1,0)$ to the point in question, is the multiplication table by this.

One use of this rotation-as-multiplication, is the cyclic functions are represented as a finite curve in the polar notation. It is used extensively in electrics because inductances and capacitances behave as complex resistances, leading and laging the voltage.

The graps shown above are coloured, because they are trying to show information at each point of the plane. That is, you can't just have a plot of the result against an input on a plane: the input is the plane, and we leave it to other devises to indicate what the output is doing.