I just wonder how do you plot a function on the complex plane? For example,$$f(z)=\left|\dfrac{1}{z}\right|$$ What is the difference plotting this function in the complex plane or real plane?
3 Answers
First, the graph of a complex function is by definition $\{(z,w)\in{\mathbb C}^2: w=f(z)\}$, which lives in 4D. Thus, there's not a "simple" way to visualize this.
Nonetheless, there are a number of standard tricks to help us visualize the function. Perhaps the most standard is to illustrate the effect that the function has on some standard domain or set of domains. If you type "plot 1/z" into WolframAlpha, for example, you'll see a number of images related to the function, one of which is labeled "Complex map" and looks like so:

This illustrates how a grid of lines throughout the square $[-1,1]\times[-1,1]$ is affected by the map $z\rightarrow 1/z$. This is a bit like trying to understand the map $f(x)=x^2$ by examining the following picture:

The top picture represents a set of points evenly distributed throughout the interval $[0,2]$; the bottom illustrates the image of the points under $f(z)=z^2$.
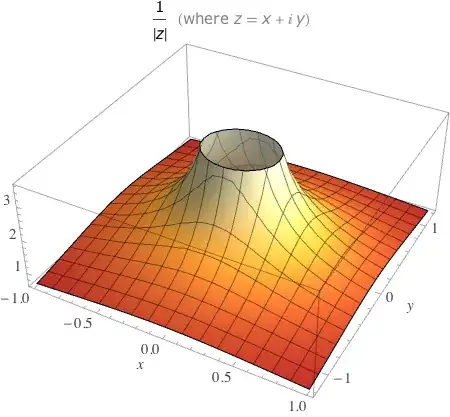
I reiterate, though, this is just one of a number of techniques for visualizing these types of functions. Other possibilities include: plotting the real and imaginary part as 3D graphs, doing the same with the magnitude and argument, or creating contour plots of these. This works because for example, writing $w=|f(x+i*y)|$, we see that $w$ is a real-valued function of the two real variables $x$ and $y$, which means we can make a 3D plot. Here's the result of the WolframAlpha query "plot |1/z|", for example:

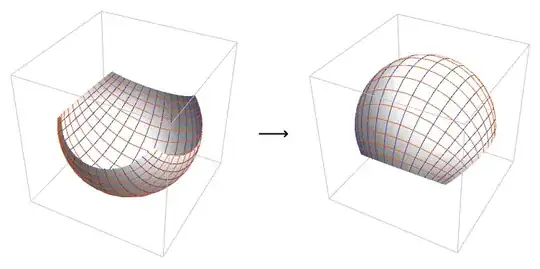
It can get really crazy if you move to the Riemann sphere. Here's WolframAlpha's "Riemann sphere map":

To really understand this, you should check out the video Möbius Transformations Revealed on YouTube!
- 30,510
-
Here my question comes then, I got these pictures as well, but is this 3D picture then a complex plane? I know because z=x+iy be have to have a picture in 3D of course. I am not sure what it means then plotting this punction in complex plane. Thanks by the way... – Berrier May 23 '13 at 10:35
-
The complex plane is the domain of the function. If we write $z=f(x+iy)$, then in the picture the complex plane is the horizontal plane where $z=0$. – Mark McClure May 23 '13 at 11:17
Note that for representing real number, we need only one axis (x or y ,one dimension). But for representing complex number we need two axis (x and y, two dimension). In some sense, there is no difference between real plane and complex plane.
For the function $f(z)=\frac{1}{z}$
if $z$ is allowed to take only real number, it is a two dimensional plot on real plane ($R^2$, x-y axis), x-axis for taking all real number and y-axis for taking all corresponding function value (which is a real number)
if $z$ is allowed to take complex numbers, it is a four dimensional plot on $R^4$ ($x-y-x_1-y_1$ axis), $x-y$ axis for taking all real number and $x_1-y_1$axis for taking all corresponding function value (which is a complex number) . It is very difficult to visualize.
- 231
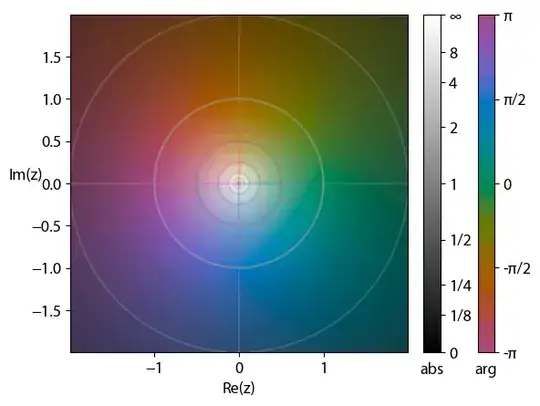
A common way of plotting complex function is to use domain coloring. In the polar form of your function values $f(z) = r \exp(i\phi)$, modulus $r$ is associated with brightness and argument $\phi$ with "hue". This taps into the visual system of the brain and helps getting a fast grasp on those otherwise hard-to-visualize functions.
With cplot, a Python package I recently wrote, it's easy to create such plots. Also check out the gallery! For your function:
import cplot
plt = cplot.plot(lambda z: 1 / z, (-2.0, 2.0, 400), (-2.0, 2.0,400))
plt.show()
- 1,535

http://en.wikipedia.org/wiki/Color_wheel_graphs_of_complex_functions
– Chris Brooks May 21 '13 at 15:24