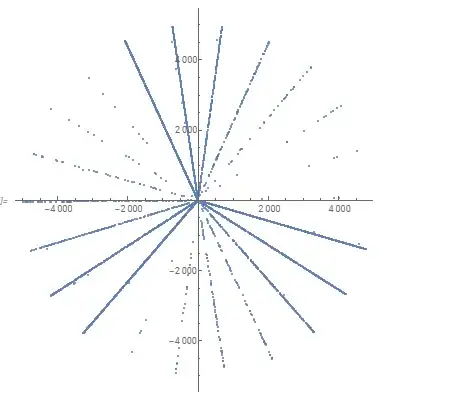
I recently found out that Mathematica can plot polar coordinates, and I really liked polar plotting. Today, I found something surprising. The $n$ th prime gap is defined as $$g(n)=p_{n+1}-p_n$$ I made a polar plot of $(g(n),n)$ and this is the result:
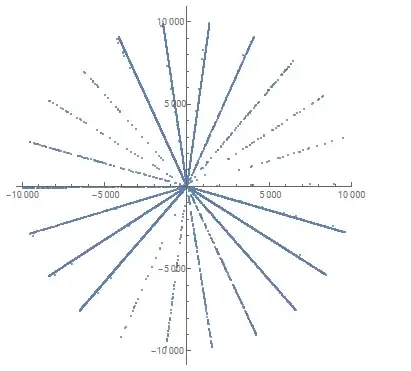
This surprised me, because prime gaps tend to be in some diagonals more than others, and there are some areas left untouched. Here is a plot with from $-10000$ to $10000$:
And this pattern continues to hold. My question is:
Why do prime gaps tend to be in some "lines" in the plot more than others? What is special in them?
Another thing:
Does this tell us anything about prime gaps?

