Let me share a kind of visualization of group tables which is especially well suited for cyclic groups like $\mathbb{Z}$ and $\mathbb{Z}/n\mathbb{Z}$. In these groups you can easily give colors to each group member $k$ with
hue = red if $k > 0$ (for $\mathbb{Z}$) or $k \leq n/2$ (for $\mathbb{Z}/n\mathbb{Z}$)
hue = blue otherwise
lightness = goes from 0 to 1 for $|k|\rightarrow \infty$ (for $\mathbb{Z}$) or for $k \rightarrow n/2$ (for $\mathbb{Z}/n\mathbb{Z}$)
So $k=0$ always looks black while $k = \infty$ resp. $k=n/2$ looks white.
My question is:
Which specific number- or group- or ring-theoretic facts can be learned from looking at these group tables?
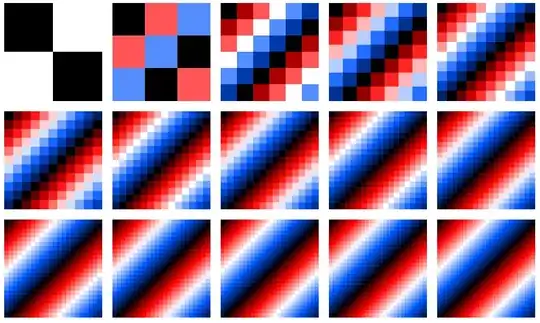
It comes as no surprise that all addition group tables for $\mathbb{Z}/n\mathbb{Z}$ look essentially the same, independent of the nature of $n$ (be it prime or whatsoever):
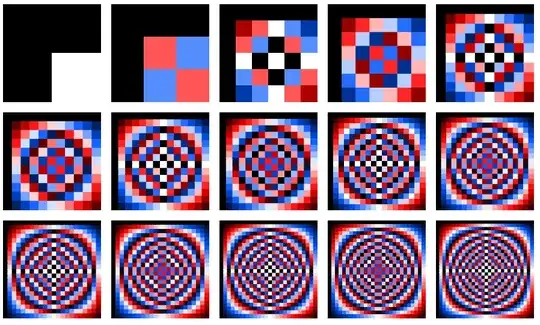
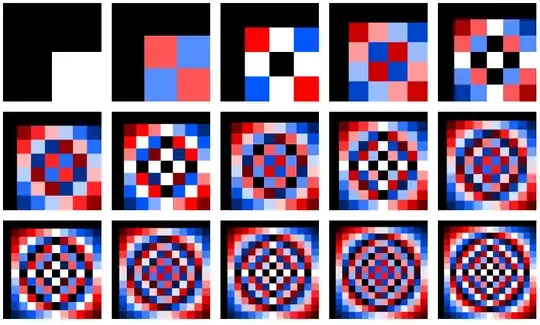
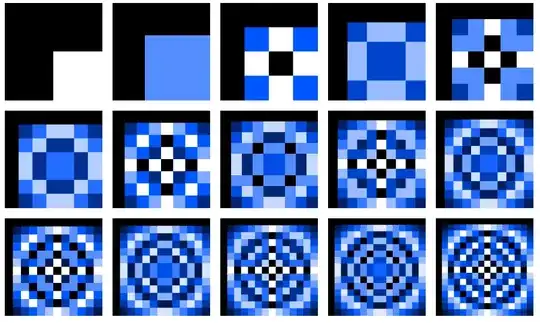
But also the multiplication group tables exhibit quite regular patterns. But this time there are at least two of them: those with a distinguished black/white pattern at the center and those with a distinguished red/blue pattern:
A closer look at consecutive $n$ reveals another detail: the black/white and the red/blue patterns at the center flip every second step:
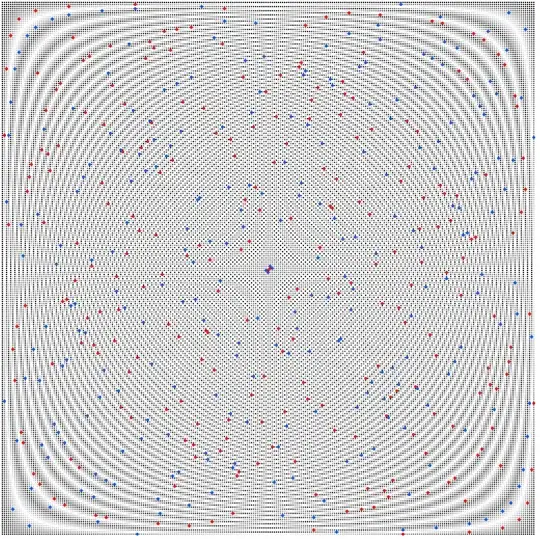
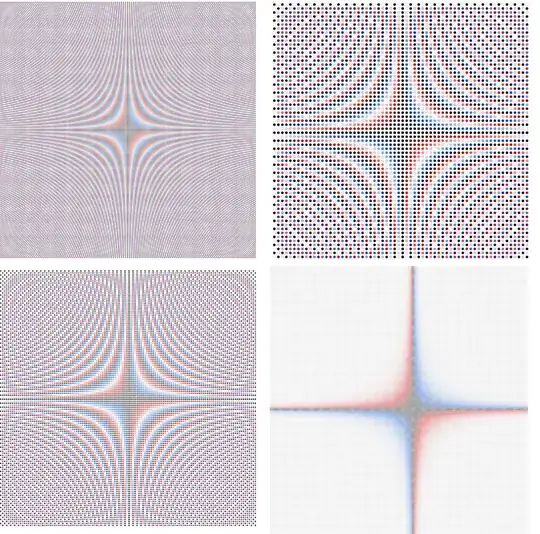
So far, so good. What remains interesting is the "limit pattern" which is approached for $n \rightarrow \infty$. It looks something like this (for $n=64,128,256, 251$):
As you may guess there is not a unique limit pattern, but only a kind of pattern whose details depend on $n$ (mainly its size), especially the distinctness and size of "subcenters" (next to the "main center" at $(\frac{n}{2},\frac{n}{2})$), e.g. of the four subcenters in the cases above which you may immediately see (near the centers of the four quadrants).
Note again that the existence and visibility of such subcenters are independent of the nature of $n$ – just compare $n=256$ (a power of 2) and $n = 251$ (a prime number).
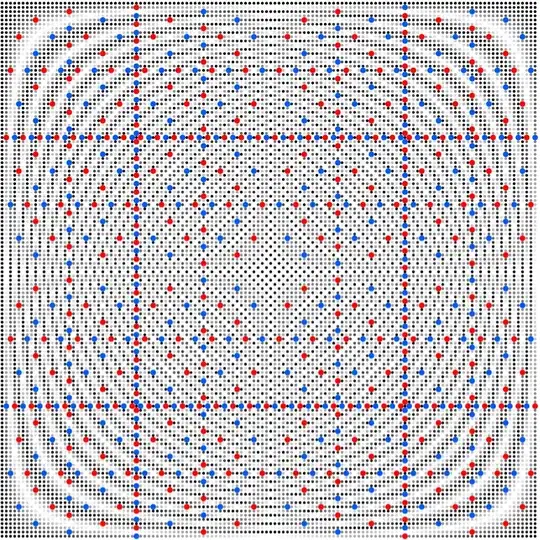
Here is the multiplication group table for $n=512$:
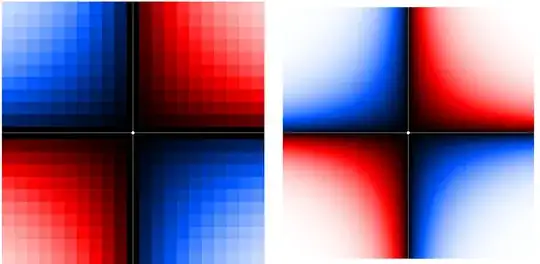
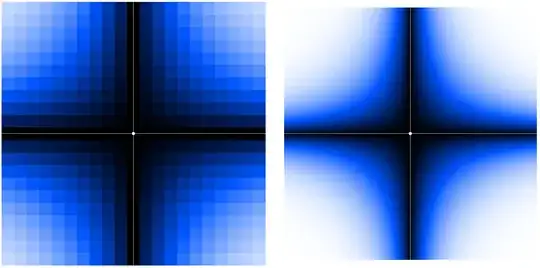
For the sake of comparison here are the addition and multiplication group tables for $\mathbb{Z}$ itself (for $|k| < K$, $K = 10,100$:
To repeat my question:
Which specific number- or group- or ring-theoretic facts can be learned from looking at these group tables?
To ask one specific question:
How can the hyperbolas be explained which can be observed at the center of each plot, be it for $\mathbb{Z}$ or $\mathbb{Z}/n\mathbb{Z}$?
For another sake of comparion: See here some group tables with red = blue:
