Speculative Comment. Certainly not an Answer.
If you have an actual application in mind, please give approximate
means and standard deviations. Also, as @Mathematical has pointed out,
normal distributions have no true maximum value, although there is
little chance of a value more than four standard deviations above
the mean. So instead of a maximum, would you be happy with a value
not likely to be exceeded 1% of the time? 0.01% of the time?
Here is one
possibly relevant item on this site. It probably doesn't answer your
question, but it may help you sharpen up your description of what you're
looking for. (And it has some interesting links.)
Suppose $X \sim \mathsf{Norm}(\mu_x=100,\sigma_x=15)$ and $Y \sim \mathsf{Norm}(\mu_y = 200,\sigma_y=10).$ Then a simple simulation will give you a pretty
good idea of the distribution of $W = XY.$ You can easily get approximations
of $\mu_w = E(W),\,\sigma_w = SD(W),$ and even the 99th quantile $q$ of $W,$ which
is $q$ such that $P(W \le q) = 0.99.$ Note that $X$ and $Y$ are independent in this simulation. (This simulation used R statistical software,
which is freeware, but many math and stat software packages could do something
similar.)
m = 10^6;  x=rnorm(m, 100, 15);  y=rnorm(m, 200, 10)
w = x*y;  mean(w);  sd(w);  quantile(w, .99)
## 19997.9    # aprx E(W)
## 3170.564   # aprx SD(W)
##      99%
## 27581.54   # aprx q with P(X < q) = .99
Below is a histogram of the simulated distribution. The vertical red line
cuts 1% from its upper tail. The curve is the density curve of a normal
distribution with a mean and SD suggested by the simulation.
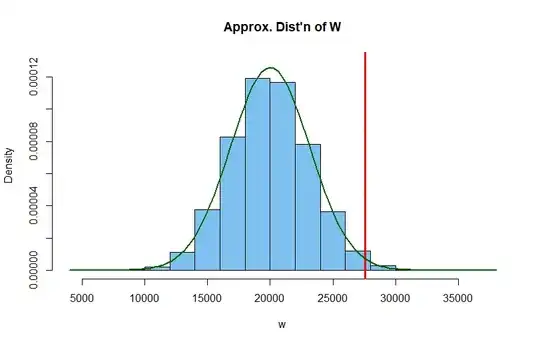
This simulation suggests that the product $W$ may be approximately normal,
but in general, the product isn't normal. Sometimes not even close. Never
make an important bet on the basis on one simulation.
Based on this arbitrarily chosen simulation, maybe you are interested
in pursuing the theory behind your question, maybe you will want to try more
simulations (matching an actual applied problem of interest), or maybe
this will be the end of your interest. Particularly if you want to pursue
the theory, please edit your question to be more specific about your goals.
