This answer shows a diagram representing a series of partial sums of the zeta function in the complex plane, and says that it shows figures looking like Euler spirals. I have plotted a similar diagram: an enlargement at the origin shows the partial sums (black) superimposed on a Euler spiral (green) plotted between appropriate centres. The partial sums are close to, but not exactly on the spiral. I have been unable to find a curve which could replace the Euler spiral and give an exact match.
-
@user1952009 I get this link. How is that relevant? – user258279 Mar 05 '17 at 09:18
1 Answers
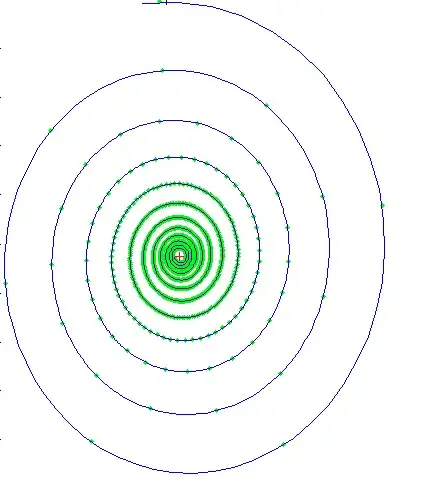
If I understood well, you want to understand the spiral appearing when plotting $\zeta_N(s) = \sum_{n=1}^N n^{-s}$ for $N \in \{1\ldots 10^4\}$.
There is a plot of $\zeta(s)-\frac{N^{1-s}}{s-1}$ in blue and $\zeta_N(s)$ in green, the red cross being $\zeta(s)$ at $s= 1.4+8i$.
Since $\zeta(s)-\zeta_N(s) = \sum_{n = N+1}^\infty n^{-s} \approx \int_N^\infty x^{-s}dx =\frac{N^{1-s}}{s-1}$ it explains why the two spirals are so close.
What to say more ?
You can get a better approximation of $\zeta(s) - \zeta_N(s)$ with more terms (in $N^{-s},N^{-s-1},\ldots,N^{-s-j}$) see the Euler-Maclaurin formula.
Also the blue and green spirals get very close when $N$ is large enough
The more $Im(s)$ is large, the more the green plot is messy for $N$ small and the more $N$ needs to be large for making a nice spiral appear.
- 77,999
-
That's nice, but the blue function is not really a spiral curve, it's a series of 10000 points to which you have fitted a spiral-like curve somehow. I am looking for a continuous curve which fits the green points exactly. – user258279 Mar 06 '17 at 07:41
-
@shortcipher The blue curve is $\zeta(s) - \frac{x^{1-s}}{s-1}$ for $x \in [1, \infty)$ – reuns Mar 07 '17 at 04:33
-
@shortcipher And why would you want to fit exactly the partial sums ? In that case look at $f_s(A) = A^{1-s}+ s\int_1^A \lfloor x \rfloor x^{-s-1}dx$ it is a differentiable curve such that $f_s(\lfloor A \rfloor) = \sum_{n=1}^{\lfloor A \rfloor} n^{-s}$ – reuns Mar 07 '17 at 04:42
