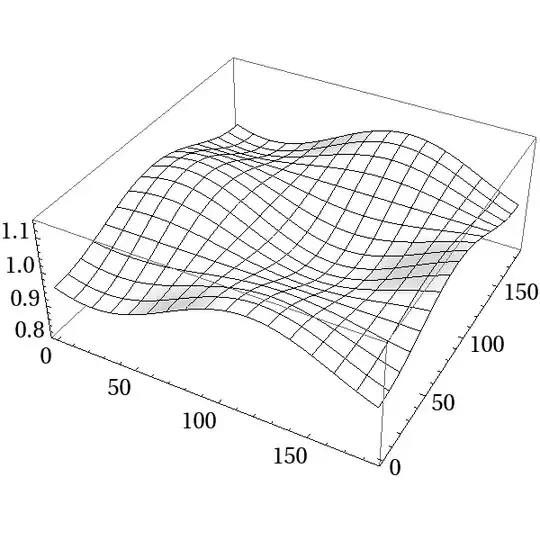
I have thousands of data files which are essential DFT data of plots such as this:
And a DFT of the plot with a "Hard" threshold of 0.9 gives me:
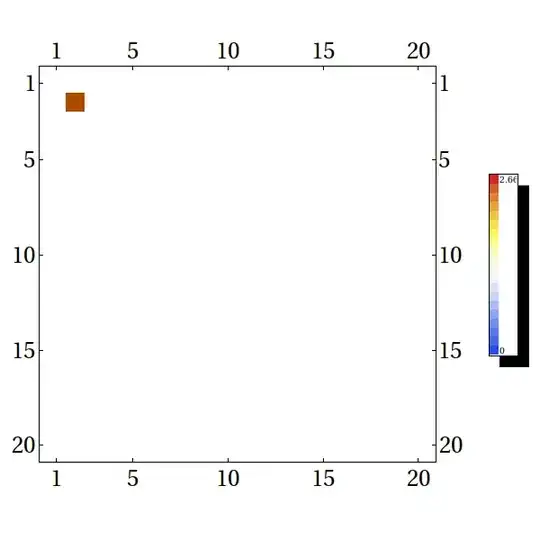
This DFT is just the left top corner of the DFT data with the DC value removed.
The reason I used a threshold value of 0.9 is because in the DFT coefficient matrix that I plotted above, most of the values of very small (~10^-4) and there are maybe 1-2 values that influence the DFT and they are above 0.9
However, it was suggested that I use a Frobenius Norm of my DFT data to threshold my plots.
Why is that? I can't use a Frob. norm as a threshold because it is a very large value ~100 and my DFT coefficient matrix is populated with numbers <100 generally
Should I just divide my DFT data with the Frob. norm? I have read the following posts 1 2 3
~Concerned Mechanical engineer