(*Mathematica 8 start*)
Clear[n, k, t, z, FL, NZ]
N[ZetaZero[127]]
NZ[t_] = Arg[Zeta[1/2 + I*t]]/Pi;
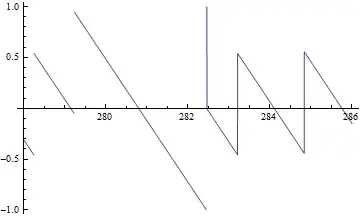
Plot[NZ[t], {t, 280, 284}]
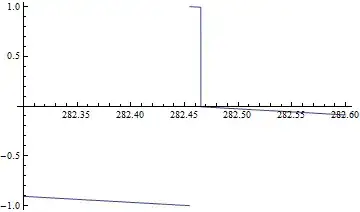
Plot[NZ[t], {t, 282.3, 282.6}]
Look at these two graphs of $$\arg(\zeta(1/2+I\cdot t))$$ around the Riemann zeta function zero 0.5 + 282.465 I:
Is it correct that close to $t=282.465$ the graph should make a jump increase of size $2$, and then should continue only slightly downwards, and then should suddenly decrease a step of almost equal to $1$? Should it be that way?

