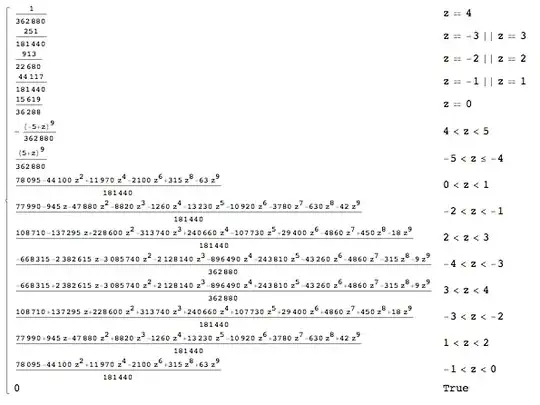
Suppose I draw several times from an uniform distribution, $X\sim\mathcal{U}(0, 1]$. (I'll use $\mathrm{R}()$ to denote an independent drawing.) What is then the PDF of several draws, added and/or subtracted from each other? How do I calculate it?
For example:
$r = \sum_{i=1}^{5} \mathrm{R}() - \sum_{i=1}^5 \mathrm{R}()$
If I draw 15,000,000 samples, round them, and note their total number of occurrences, the plot I get looks like a normal distribution with $\mu = -2.5$. But “looks like” is not really satisfactory, because I am not even sure whether it really is a normal distribution I'm getting this way.
Can somebody help me to derive the type of distribution and its parameters of the formula above (or any other formula where several independent draws are added/subtracted)?
