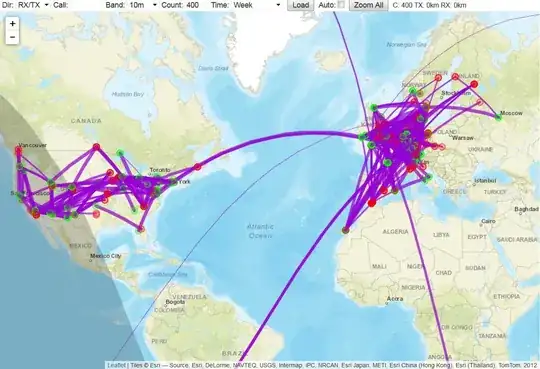
I would like to analyze data from the Weak Signal Propagation Reporter (WSPR) and/or the Reverse Beacon Network to understand the propagation mode(s) of the recent welcome spate of CW and SSB contacts between North America and Europe on the 10 meter band. I was able to create a WSPR map of the past week's events, but I'd like to reduce the temporal granularity. Does anyone know of a site or tool that provides this ability?
Asked
Active
Viewed 199 times
1 Answers
1
For WSPR, all spots are available for download at http://wsprnet.org/drupal/downloads
"The entire database of millions of WSPR spots is available for public download in comma-separated value (CSV) format compressed with the gzip and zip utilities. Each file contains the data for one calendar month of spots."
Every spot is stored as a line in a CSV file, along with the time. Time is rounded off to two minutes, which is the finest it will get as the transmissions are on a 2-minute cycle.
The columns are:
SPOT#   Unix Time   Receive Grid    SNR Frequency   Transmit  Grid  Pwr Drift   Range   Head   Band  version    Errorcode
2397255 1228089600  K1JT    FN20    -11 3.594062    HB9CZF  JN47ch  37  0       6390    296     3   1.1_r1042   0
Now your problem becomes how to aggregate gigabytes of text into a useful map.
tomnexus
- 11,076
- 16
- 31
