According to Wikipedia, all of Neptune's inner moons can cause solar eclipses. At that distance, "the Sun's angular diameter is reduced to one and a quarter arcminutes across". Triton has an angular diameter of 26 to 28 arcminutes, so it can easily cover the Sun. However, Triton eclipses are quite rare, due to its highly inclined orbit. Also, these eclipses are very brief, because Triton's orbital period is only 5.876854 days (~5 days, 21 hours) and its orbit is retrograde relative to Neptune's axial rotation.
The Triton eclipse season occurs twice per Neptune's orbital period (164.8 years), and it's possible for Triton to eclipse the Sun several times during this period.
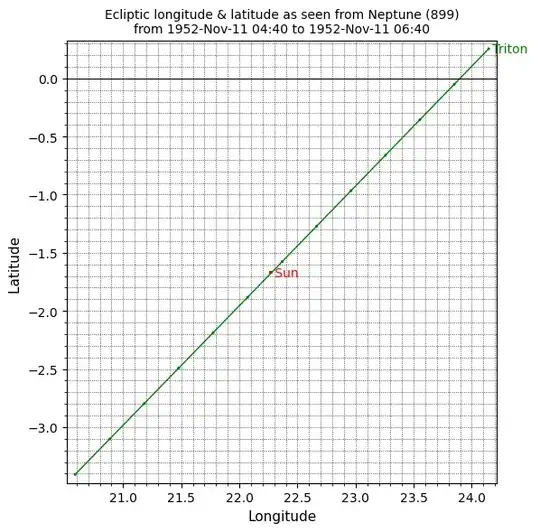
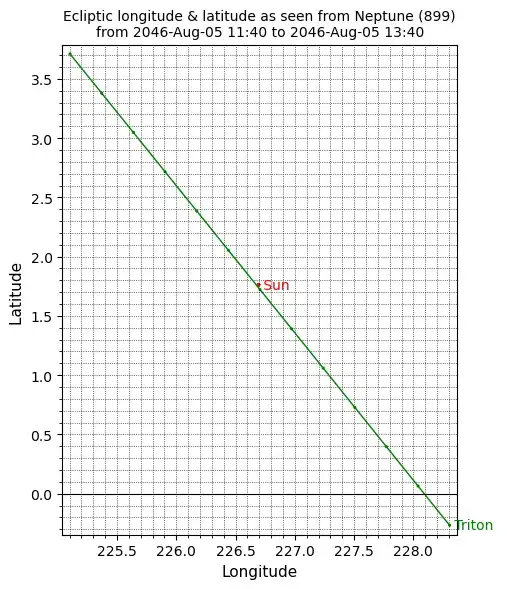
The most recent eclipse season occurred in late 1952 / early 1953. I think the closest eclipse occured on 1952-Nov-11 5:43 UTC. The next eclipse season will be in 2046, with the eclipses on 2046-Jul-30 15:39 and 2046-Aug-5 12:41 both being very close.
Here are some ecliptic latitude & longitude plots, produced using Horizons. The timestep is 10 minutes.
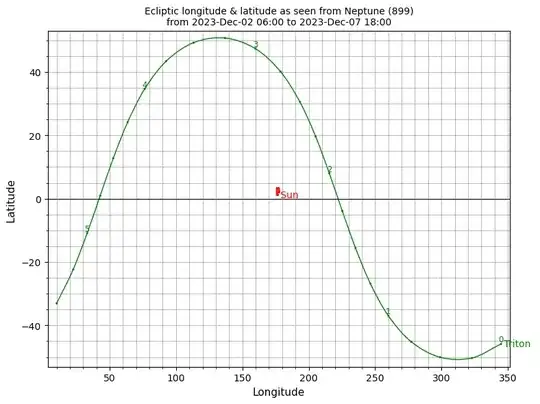
Here's a plot for (most of) a recent orbit of Triton, with a 6 hour timestep.
And here's the plotting script. The controls are similar to my 3D orbit plotting script given in this answer. Set the aspect_ratio to zero to use the default aspect ratio chosen by matplotlib. The offset option puts 0° longitude in the centre of the plot. The curve option will generally create a mess if the longitude wraps around.


