Questions tagged [gdb]

A source level debugger based on ptrace for *NIX systems and developed by the GNU project.

GDB is primarily designed for debugging software during development with source available. However, it can also be used to debug without source code and debug symbols available.

It is available on most platforms and included by default in the tool chains of most Unix like operating systems. There are text interfaces as well as graphical ones such as Eclipse integration, the venerable DDD or KDBG.

You can find the comprehensive documentation here.

Default interfaces

The default interfaces are terminal based.

But you can also use the following GDB commands on the (gdb) prompt to switch the layouts on the fly (use help layout to get more information):

  • layout src (only useful with source and symbols)
  • layout asm
  • layout regs

TUI

There is the default layout src which can be invoked using the -tui command line switch.
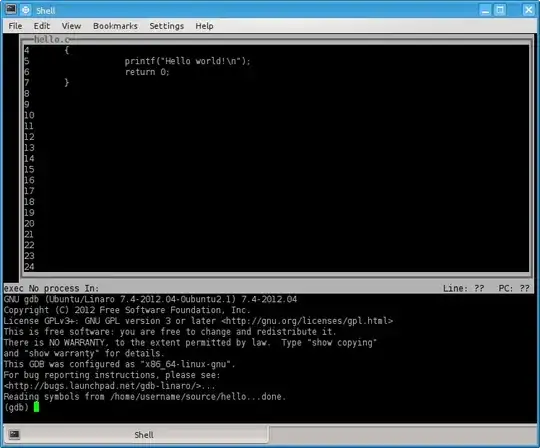
gdb -tui

Simple prompt

Default when not using any kind of command line switches.

Simple GDB prompt

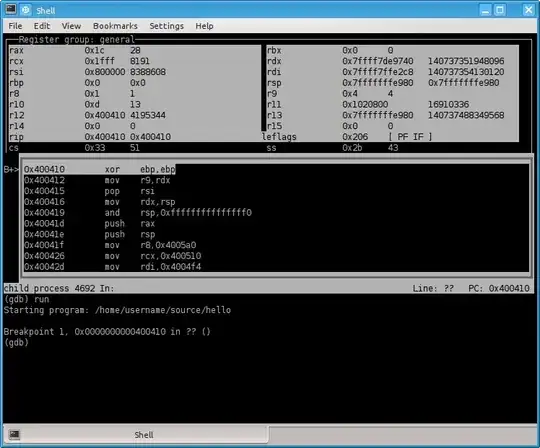
layout asm together with layout regs

This is by far the most useful layout for reverse engineering, during which debug symbols are usually unavailable. Behold:

layouts asm and regs combined

Beautiful isn't it? You can see the current values of registers, see the assembly at your current program counter, see where the break point was set and so on. And if you prefer the Intel assembly syntax like I do you issue a:

set disassembly-flavor intel

and it looks like this:

enter image description here

Debugging without debug symbols

Normally GDB will attempt to load the debug symbols from the executable itself or in the search paths it was told about. If it doesn't find any symbols or you are reversing/analyzing a target executable without symbols, you can use the following line:

disp/i $pc

to enable an automatic display for the program counter ($pc). So you see what you are going to execute. Starting with GDB 7 you can also use the following setting to achieve virtually the same: set disassemble-next-line on

If you merely want to see the current instruction use:

x/i $pc

which is short for examine.

If you wanted to make sure you don't get surprised by something running before you get control in GDB, you should use:
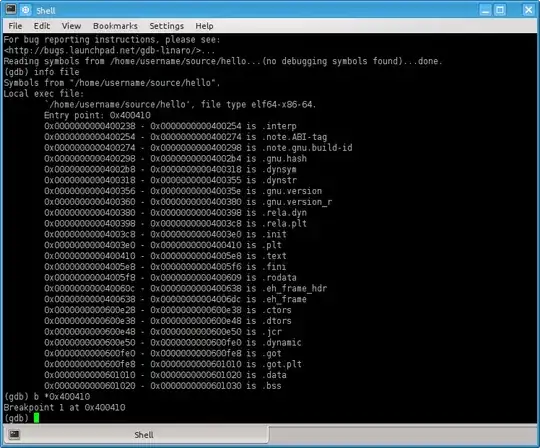
info file

which will give you an output similar to (shortened for brevity):

(gdb) info file
Symbols from "/home/username/source/hello".
Local exec file:
        `/home/username/source/hello', file type elf64-x86-64.
        Entry point: 0x400410
        0x0000000000400238 - 0x0000000000400254 is .interp
        0x0000000000400254 - 0x0000000000400274 is .note.ABI-tag
        0x0000000000400274 - 0x0000000000400298 is .note.gnu.build-id
        0x0000000000400298 - 0x00000000004002b4 is .gnu.hash
        0x00000000004002b8 - 0x0000000000400318 is .dynsym
        0x0000000000400318 - 0x0000000000400355 is .dynstr
        0x0000000000400356 - 0x000000000040035e is .gnu.version
        0x0000000000400360 - 0x0000000000400380 is .gnu.version_r
        0x0000000000400380 - 0x0000000000400398 is .rela.dyn
        0x0000000000400398 - 0x00000000004003c8 is .rela.plt
        0x00000000004003c8 - 0x00000000004003e0 is .init
        ...

and you are interested to set breakpoints at the lines for the Entry point: and the one with .init (a runtime function running before the entry point):

(gdb) b *0x400410
Breakpoint 1 at 0x400410
(gdb) b *0x00000000004003c8
Breakpoint 2 at 0x4003c8

Notice how we use the asterisk (*) to specify an address for the break point command.

Refining what assembly we see

(gdb) x/5i $pc
=> 0x400410 <_start>:   xor    %ebp,%ebp
   0x400412 <_start+2>: mov    %rdx,%r9
   0x400415 <_start+5>: pop    %rsi
   0x400416 <_start+6>: mov    %rsp,%rdx
   0x400419 <_start+9>: and    $0xfffffffffffffff0,%rsp

Both examine and display allow us to specify the number of instructions we want to see like this to show 5 instructions:

x/5i $pc

we can also tell it to show starting from before the current program counter:

x/10i $pc-3

last but not least we can change from AT&T syntax to Intel syntax:

set disassembly-flavor intel

Example:

(gdb) x/10i $pc-3
   0x40041a <_start+10>:        and    esp,0xfffffff0
=> 0x40041d <_start+13>:        push   rax
   0x40041e <_start+14>:        push   rsp
   0x40041f <_start+15>:        mov    r8,0x4005a0
   0x400426 <_start+22>:        mov    rcx,0x400510
   0x40042d <_start+29>:        mov    rdi,0x4004f4
   0x400434 <_start+36>:        call   0x400400 <__libc_start_main@plt>
   0x400439 <_start+41>:        hlt    
   0x40043a <_start+42>:        nop
   0x40043b <_start+43>:        nop
271 questions
13
votes
4 answers

How can breakpoint be set using offset in ELF file, not virtual address?

First, generate a simple executable. (ignore the warnings, the executable runs anyway) echo 'main(){puts("123");}'|gcc -x c - -o a Load it with gdb a, then: (gdb) info file Symbols from "/home/user202729/PINCE/a". Local exec file: …
user202729
  • 675
  • 1
  • 4
  • 14
10
votes
1 answer

Run command on breakpoint without stopping

I'd like to automate the following in my .gdbinit: break boost::uuids::detail::sha1::process_bytes # When execution stops at the above breakpoint, # I want to display the contents of `rcx` as a string: x/s $rcx c # do not stop here How do I…
Attila O.
  • 203
  • 2
  • 7
7
votes
1 answer

Setting GDB watchpoint on a string

I am attempting to reverse engineer a 32-bit stripped, dynamically linked ELF executable. I want to know when a specific string is printed to the console. I ran the following command: root@testbox> strings -a --radix=x binfile | grep -i reset d38c4 …
Compster
  • 369
  • 2
  • 9
4
votes
1 answer

Is there something like follow-fork-mode for gdbserver?

My question is quite straight forward: is there a possibility to tell gdbserver to follow the child when forking like set follow-fork-mode child
sqrtsben
  • 330
  • 2
  • 6
4
votes
0 answers

Is there a way to reprint the screen in gdb gef?

I am using gdb-gef and I've searched the manual several times for the answer to this question. Sometimes I run a lot of commands and I would like to re-draw the current program state the way gef displays it when I step through the program (registers…
the_endian
  • 1,860
  • 17
  • 39
4
votes
1 answer

How to set breakpoint with gdb on arbitrary memory location?

I'm trying to debug some code on Linux. There's an arbitrary memory location I need the program to jump to. This location is result of calling mmap with appropriate protection flags for executing a piece of code. When trying to set break point like…
Michael Kruglos
  • 143
  • 1
  • 5
3
votes
3 answers

Why does my shellcode work in gdb but not on the command line

So I just started with reverse engineering and have run into some issues until I recently noticed something strange. I wrote an extremely simple shellcode (exit system call) for practice and I played around with it in gdb. I use the following code…
L. Heldt
  • 173
  • 2
  • 5
3
votes
1 answer

How to test if register value is unavailable in gdb?

I'm using a .gdbinit file that is supposed to print the values of all registers at every hook_stop, followed by the stack and data frames. However, when running many programs, there are often segment registers that are unavailable, which is causing…
camercu
  • 133
  • 6
2
votes
0 answers

can't debug properly

In the last few days I tried to solve "unlink" challenge in pwnable.kr and I'm struggling to attach a debugger remotely and locally on the server using pwntools (code added below). #!/usr/bin/env python3 # -*- coding: utf-8 -*- from pwn import…
talsim
  • 21
  • 2
2
votes
1 answer

gdb don't break when I use exec-wrapper script to exec my target binary

Why gdb doesn't break when I use exec-wrapper script to exec my target binary. Here my little test. I use a binary with no pie option to use predictable address. $ gcc -no-pie main.c I have this litle gdb exec wrapper script. $ cat wrapper.sh…
user23611
2
votes
1 answer

Question about gdb and memory addresses

i am trying to use gdb to analyse a c program but i am a little confused. in the above picture you can see i am trying to analyse the stack . On the left we have memory addresses.Since i am using a 64 bit machine ,shouldn't ever memory address…
shujaat
  • 31
  • 1
  • 1
  • 3
2
votes
1 answer

How to set breakpoints in GDB on remote target without an executable?

I'm trying to use a gdb client running on my host machine to talk to a GDB server running on a debug probe. I can connect using the "target remote" command, and I can single step, use monitor commands to restart, etc. I can not set breakpoints…
user19009
  • 154
  • 1
  • 7
2
votes
1 answer

How to read canary value in gdb?

In a program I am debugging, the canary value is read to eax from gs:0x14 memory location. I am attaching gdb to the process late enough to break on the mov reading the canary to eax. Therefore, reading eax is not an option to me. How can I read…
sherlock
  • 1,381
  • 3
  • 23
  • 40
2
votes
0 answers

What does 'mapped' memory region mean in gdb-peda?

I was reading a write-up of a binary exploitation where I came across the following: What does the mapped keyword listed under Name column mean? What sort of memory region does it refer to?
sherlock
  • 1,381
  • 3
  • 23
  • 40
2
votes
1 answer

Why can't gdb read memory if pwntools is used to send input?

Here is the program which gdb is attached to: prog.c #include void dummy(char* s) { } int main() { char buf[512]; scanf("%s", buf); printf("%s\n", buf); dummy(buf); return 0; } It is compiled with: gcc prog.c o…
sherlock
  • 1,381
  • 3
  • 23
  • 40
1
2 3