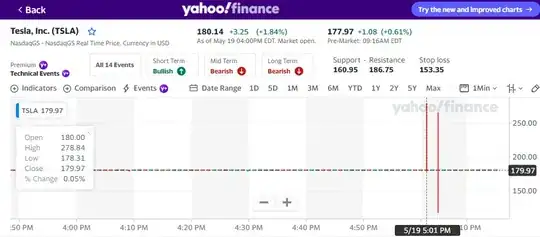
Looking at various stock (TSLA in the picture below on May 19, 2023) pre and post market trading graphs, I can nearly every day see some huge variations, way over market fluctuations, which I think do not make any sense (in the example below, we see back & forth jumps of +54.91% and -53.32%, even when we last saw TSLA taking a hit, it was not even -20% and it took a good hour to happen).
Looking at some other graphs (Google/Ameritrade/E*Trade), I do not see these variations making me think it's just a small glitch in the Yahoo! Finance display (although doing a reload doesn't fix anything, so the funky data would be on Yahoo!'s servers too).
So my question is: Should I ignore those extra-ordinary fluctuations? Or are these real (just too small to be shown on other services)?
The picture shows that the closing price was 180.14. After hours, it stayed pretty stable around 180.01 and 179.99. However, at 05:01 PM, as we can see on the left, the price jumped all the way to 278.84 and at 05:03 PM also down to $117.40. These numbers don't seem to make sense when the stock is currently traded at about $180. Why would someone sell at $117.40 when they could get an extra $63/share or buy at $278 when they could save nearly $100 buying that same stock?
