Possible Duplicate:
Intuition for graphing Sine/Cosine
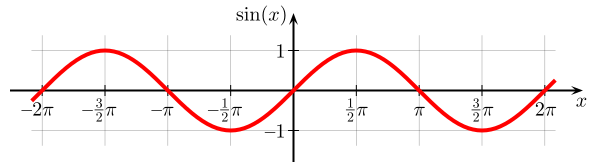
We've all seen the graph of $y = \sin x$
(I can't post an image because of reputation so I posted a link to a graph)
As off now, the only definitions of Sine I understand is the "ratio in a triangle" definition, and the "unit circle" definition. So I hope it's possible to answer my question using one of these definitions.
From these definition it's easy to see why at ($0.5\pi$) radians the value of $y$ is $1$, it's easy to see why at Pi radians that value of $y$ is $0$, and I can certainly see why the function repeats itself every $2 \pi$ radians, using the unit circle definition.
What I don't understand is why it has this exact shape, why does it look like it does between 0 and 0.5 Pi, why does it have this exact concavity?
- Does this have an intuitive explanation?
- How did the first mathematicians draw this function, did they actually measure the Sine of all the angles with a ruler and than drew the graph?