0

I am trying to find a least-squares ellipse fit for a set of 100 data points $(x,y)$.

Now I have found the values of $A,B,C,D,E,F$ according to the conical equation of the ellipse $$ Ax^2+Bxy+Cy^2+Dx+Ey+F=0 $$ I would like to know how to find the points that actually lie on this ellipse. From my basic understanding, if I substitute a value of $x$ in the above equation, it should give me the corresponding value of $y$.

When I do the above, I get a straight line and not really a fitted ellipse. How can I find the fitted ellipse?

My task is to plot these points so that I can see the best possible fit. For reference see [link]. This is the source of ellipse fitting that I am currently using.

I appreciate help from anyone who has experience with this. I am sorry if I am lacking some basic mathematical knowledge, but from what I understand, it isn't all that straightforward.

Regards

Arj
user0
  • 3,247
  • Try to google "fitting the ellipse" and maybe this will help: http://www.cs.cornell.edu/cv/OtherPdf/Ellipse.pdf – user35603 Aug 13 '14 at 10:55
  • Formulas look there. Or choose other. http://math.stackexchange.com/questions/809907/proving-a-pellian-connection-in-the-divisibility-condition-a2b21-mid-22/809929#809929 – individ Aug 13 '14 at 11:15
  • "I get a straight line and not really a fitted ellipse" - This doesn't sound right. What were the parameters? What values of x did you use? Can you post how you found the y values? They are not linear in x unless A,B,C are small relative to the other params, I think? – Sanjay Manohar Aug 13 '21 at 11:32
  • @Arjun Sachdeva. You should joint to your question an example of your data ( numerical not graphical ). Without data one cannot reproduce your calculus and see if there is a mistake. – JJacquelin Jul 19 '23 at 06:35

2 Answers2

0

A sure way to determine whether a point lies on the ellipse is to substitute the point's x- and y-coordinates into the equation and see whether the equation is exactly satisfied. (Your method is also valid, but requires more work.)

An example of how to use MATLAB to plot a curve and points is at https://www.mathworks.com/help/curvefit/fit.html. You will need to solve your equation for y. Be careful, though, because a point may appear to be on the ellipse but actually not be on it.

user0
  • 3,247
0

Given a ellipse as

$$ E(x,y)=Ax^2+B xy+Cy^2+D x+ E y + F=0 $$

and a data set as $(x_k,y_k),\{k=1\cdots,n\}$ a typical fitting process is to minimize the residuals at each point, squared so defining

$$ R(A,B,C,D,E,F) = \sum_{k=1}^nE(x_k,y_k)^2 $$

the problem reads as

$$ \min_{A,B,C,D,E,F}R\ \ \ \ \text{s. t.}\ \ \ \ \cases{B^2\lt 4A C\\ A^2+B^2\gt \mu} $$

those restrictions are needed first to guarantee that the fitted conic is an ellipse and second to avoid the undesirable trivial minimum $A=B=C=D=E=F=0$. Follows a MATHEMATICA script showing the procedure

(** DATA GENERATION **)
Clear[a, b, c, d, e, f, ellipse]
r[a_, b_, theta_, t_] := a Sqrt[2]/Sqrt[(1 + (a/b)^2) + (1 - (a/b)^2) Cos[2 (t - theta)]]; 
data = With[{a = 1, b = 1/2, theta = Pi/3, x0 = 1, y0 = 1}, Table[{x0, y0} + {Cos[t], Sin[t]} r[a, b, theta, t] + RandomVariate[NormalDistribution[0, .05], 2], {t,RandomVariate[UniformDistribution[{0, 2 Pi}],100]}]];
gr1 = ListPlot[data, PlotStyle -> {Red,PointSize[Medium]}];

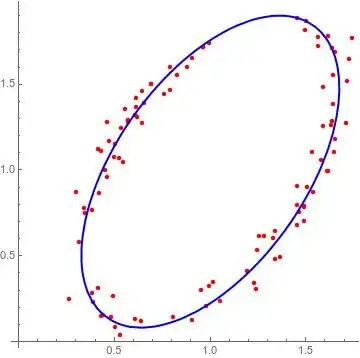
(** DATA FITTING **) M = {{aa, bb}, {bb, cc}}; B = {dd, ee}; ellipse[x_, y_] := {x, y}.M.{x, y} + B.{x, y} + ff res[k_] := ellipse[data[[k, 1]], data[[k,2]]]^2 sol = Minimize[{Sum[res[k], {k, 1,Length[data]}], 4 aa cc > bb^2, aa^2 + bb^2 > 0.3}, {aa, bb, cc, dd, ee, ff}] ellipse0 = ellipse[x, y] /. sol[[2]] gr2 = ContourPlot[ellipse0 == 0, {x, 0, 2},{y, 0, 2}, ContourStyle -> {Thick, Blue}]; Show[gr1, gr2, AspectRatio -> 1]

enter image description here

Cesareo
  • 33,252