1

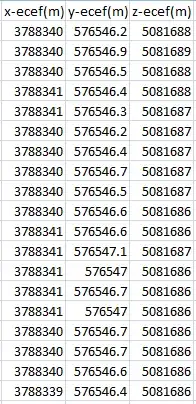
I have around 1000 values for a gps receiver position like follows: All of these values represent the SAME POINT.

First Few Values

want to find error in values? What I am doing right now is that I am finding cartesian distance between the actual value and the mean value of all 1000 readings. Then I am representing cartesian distance on a graph so it represents error. I dont think this is the right approach. What formulaes should I use or methods I should employ to show error with the readings.

orange14
  • 553
  • Presumably they are meant to represent the same point, then the errors are unconnected variables - eg weather affecting signals from satellites. So you should see if the data fits a normal distribution. I did this in sixth form college. –  Aug 02 '14 at 10:21
  • "I dont think this is the right approach": nothing wrong here. If you take the average squared Cartesian distance, you get the total variance. This is a good measure of spread. if you want a finer description, what about a histogram of the distances to the centroid ? –  Aug 02 '14 at 10:28
  • @mistermarko Yes this data represent the same point. How can I check if it fits a normal distribution. Should I find cartesian distance from the point to the mean and then represent this cartesian distance as a bar chart and then show that it looks like a bell curve and hence a normal distribution – orange14 Aug 02 '14 at 10:29
  • @YvesDaoust So what approach would you recommend. What changes should I make – orange14 Aug 02 '14 at 10:31
  • As I remember, you can type the data into a scientific calculator (in the correct format) and just apply the 'fit to normal' function. It should give a number between 0 and 1. No theory knowledge required! –  Aug 02 '14 at 10:32
  • @mistermarko: never heard of that ?! Aren't you confusing with linear regression ? –  Aug 02 '14 at 10:33
  • It seems that you want to perform a test for multivariate normal distribution. Check http://en.wikipedia.org/wiki/Normal_distribution#Normality_tests and http://en.wikipedia.org/wiki/Multivariate_normal_distribution. If I am right, the distance follows a Rayleigh distribution. http://en.wikipedia.org/wiki/Rayleigh_distribution. But do you have a serious reason to put this in doubt ? –  Aug 02 '14 at 10:35
  • @YvesDaoust I will look into these wikis. – orange14 Aug 02 '14 at 10:38
  • Your question is unclear. What do you want to assess exactly ? I am afraid that the truncation error dominates other sources of randomness, introducing strong bias in the distribution. –  Aug 02 '14 at 10:39
  • @YvesDaoust "if you want a finer description, what about a histogram of the distances to the centroid ?" Am I not doing the same. Isnt centroid the mean of the values in this case. – orange14 Aug 02 '14 at 10:39
  • Yes of course. The key point is to work on an histogram rather than a single estimator. But as long as you don't explain your purpose, all of this discussion is meaningless. –  Aug 02 '14 at 10:42
  • Complicating factor: it would be a 3d Gaussian, obviously, since the position is in a plane. We did not use these but the principle is the same - you can put the data through an algorithm and it will say how well it fits and presumably give you the standard deviation as well. The purpose is to assess the precision of GPS and therefore of any points determined with GPS(?) –  Aug 02 '14 at 10:43
  • @YvesDaoust Sorry If my question is unclear. I will give another shot to it. I have one point which keeps on changing as is shown above in the image. The readings are from a receiver. Now I place that receiver in different environment(next to trees, next to building, in open field). Now I have to see how receivers reading change in different environment. And that I can show by the amount of error in all 3 cases. next to trees error should be more compared to field as readings in open fields wont fluctuate more compared to next to trees/building environment. And so wanted to know the error – orange14 Aug 02 '14 at 10:50
  • That doesn't tell me why you don't want to just characterize the spread with the variance (or average distance). And as I said earlier, the truncation error is too large to really let you measure other error sources. –  Aug 02 '14 at 10:58

1 Answers1

1

Due to the significant truncation of the values, the quantization error dominates. So a Gaussian model does not really fit, there will be some bias. A multinomial distribution would be more rigorous (and harder to estimate).

Unless the OP has serious reasons to do so, I don't see any need to precisely model the distribution. On the opposite, as an empirical measure of the spread, the average distance to the centroid should be enough.

If in addition some insight into the anisotropy is sought, then use the correlation matrix. (Note that the trace of the correlation matrix is the average squared distance.)