While reading this answer, I clicked on the provided link to this Wikipedia page. The main article image shows the PDF of a 2D multivariate normally distributed system:
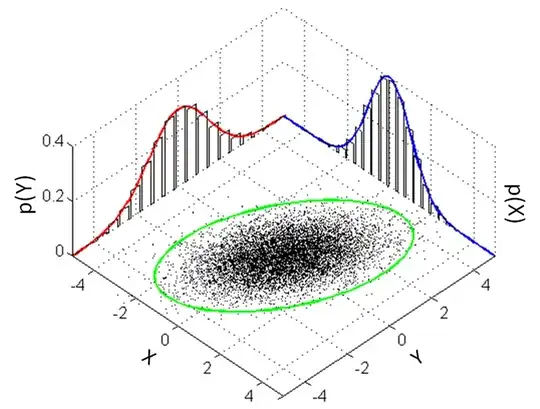
In the image, the $3\sigma$ ellipse is marked in green. Since the two variable coordinates x and y are normally (and thus symmetrically) distributed around the X and Y axes, I'd expect the ellipse's major and minor axes to be aligned with the X and Y axes. The image shows a slightly rotated ellipse.
Why is the ellipse rotated? Is it just a drawing error?
If you are familiar with R, then run the following:
– Jubbles Jun 18 '14 at 23:25install.packages('mvtnorm')require(mvtnorm)#Sample from multivariate normal distribution of independent random variablesobs <- rmvnorm(n = 10000, mean = c(0, 0), sigma = matrix(data = c(10, 0, 0, 1), nrow = 2))plot(x = obs[, 1], y = obs[, 2], xlim = c(-15, 15), ylim = c(-15, 15))