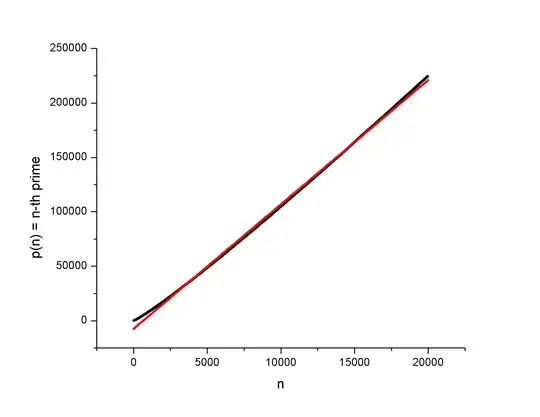
I got curious about what it would look like if I made a scatter plot of the n-th prime number as a function of n (lets call it p(n), so that p(1)=2, for instance ).
Not being an expert in the area I somewhat expected it to be all over the place, but the plot using the first 20000 primes seemed to be more well-behaved than I expected it to be. It made me wonder what would happen if I started fitting polynomials to it.
I started with a linear fit knowing it would look rough. I then calculated the relative errors, and as much as they're awful for the lowest values of n, they get much better as n grows, even for a bad fit like this. It allows for one to guess a range of values in between you're reasonably sure there's a prime, and this interval is not even that large, for this case.
My question is: Using higher order polynomials, could this strategy be used successfully to determine intervals in which there could be larger prime numbers, or does it essentially fail horribly at some point?
(Here's the plot I made)