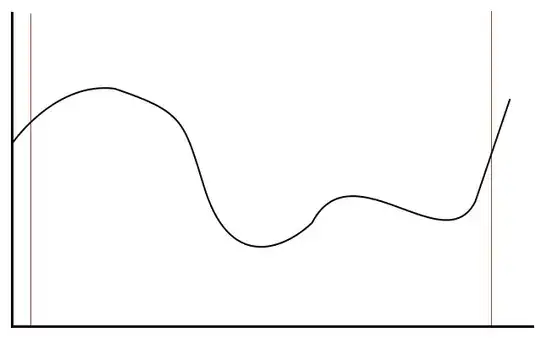
The basic problem we are trying to solve is to try to find the area under some curve over some interval. In this case this is the region bounded by the wiggly line, the $x$-axis, and the two vertical brown lines:
In fact, it's not actually clear what we mean by the "area under the curve"; we are trying to define that. But we do understand areas of rectangles, which are very simple. So we will try to divide up the region of interest into rectangles, and to approximate the area of the region as a sum of rectangles.
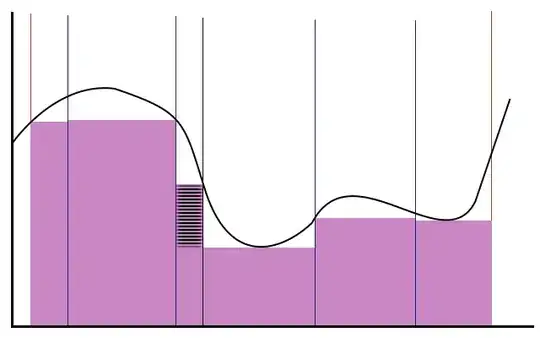
The way we do this is to ‘partition’ the region into sub-intervals, like this:
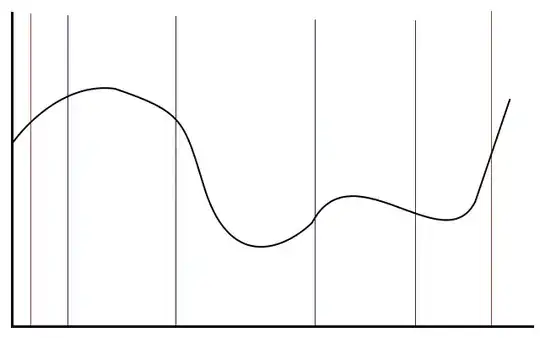
Now we have divided the region of interest into several subregions, and we will approximate each subregion separately with a rectangle and then estimate thte total area by adding up the rectangles.
But how tall should we make the rectangles? One thing we could try is to make the rectangle for each interval as tall as the highest point of the curve in that interval:
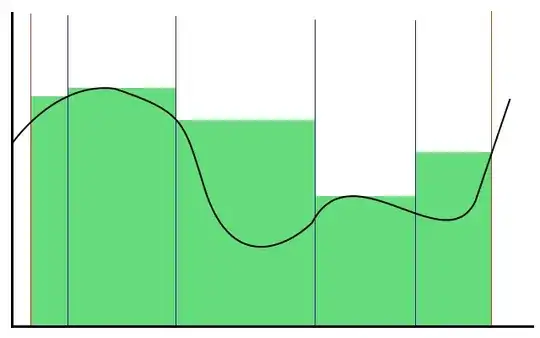
If we add up these rectangles, we will get an estimate for the total area that is too large.
Another thing we could do is to make the rectangle for each interval only as tall as the lowest point of the curve in that interval:
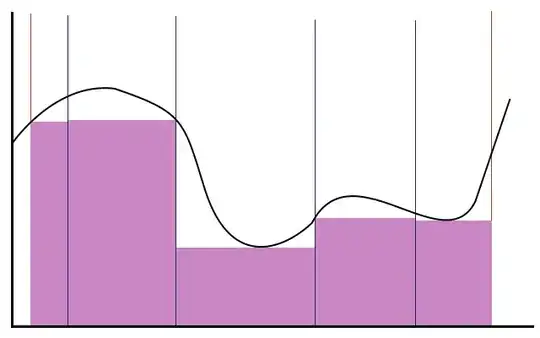
If we add up these rectangles, we will get an estimate for the total area that is too small.
The actual total area will be in between these two estimates.
The area of the purple region is an example of a lower sum for the area of the region we want. The area of the green region is an example of an upper sum.
The actual area is more than the lower sum, and less than the upper sum. By comparing the lower and upper sums, we can get an approximate idea of the area we really want: it is more than some lower sum, but less than some other upper sum.
Now if we use more strips, we can show that the lower sum cannot decrease, and it may increase. For example, here I've divided one of the intervals into two. And one of the rectangles has gotten larger as a result, because the lowest point in that strip is higher than it was before I divided it.
Dividing the strips more finely increases the lower sum (or at least, doesn't decrease it) but decreases the upper sum. (You should draw the picture yourself for the upper sum to see what happens.)
You should be able to imagine that as we divide the intervals into narrower and narrower strips, the upper sums will decrease to a limit, and the lower sums will increase to a limit. For well-behaved functions, this always happens, and
both limits are the same. When the limits are the same, we say that the function is integrable on the original interval, and that its integral is the common limit.
Now let's visit the notation. You have:
$$\bar J(f) = \inf_{h\in S(i)\atop h\ge f(i)} J(h)$$
Here $S(I)$ is the set of step functions on the interval. The step function $h$ is determining how high the colored rectangles are. (The graph of this function $h$ runs along the tops of the rectangles in the illustrations.)
If $h$ is a step function, and $h(x)\ge f(x)$ for each $x$ in $I$, then the bars at every point are at least as high as the graph of $f$. So the total area of the bars must be at least the total area under the wiggly line.
Each possible step function $h$ determines a set of bars, and so a corresponding upper bound for the area of the region of interest. We can take the set of all possible upper bounds, and since this is a set of real numbers, we can find its infimum, its greatest lower bound. Remember that the upper sums are all bigger than the actual area? (Or possibly just as big.) Then the actual area, which is smaller than all the upper sums, is a lower bound of the upper sums. The greatest lower bound of all possible upper sums is an upper limit on how big the area can be.
We can do the same thing with the lower bounds, this time using step functions which have $h(x) \le f(x)$. The least upper bound of these lower bounds is a lower limit on how big the area can be.
If the upper and lower limits are the same, we have found the area under the curve.
(Here's a detailed example of a case where they aren't the same.)
\inf_{this\atop that}to get $$\inf_{this\atop that}$$ – MJD Jun 06 '14 at 20:45