55

In this image given below, there is an actor's (famous south Indian actor Rajinikanth) image which can be seen only if you shake your head ! I had lifted this from Facebook.

enter image description here

I am just curious to know if there is any mathematical explanation for it. Is there any way to know how this image was created in the first place.

PS : If this question (although interesting) is inappropriate here, it is still okay and i hope it could be migrated to some stackexchange site.

ADDED

(...experiment to prove that it is a physical phenomenon)

After some comments expressing doubt as to whether this is a physical phenomenon, I have done a small experiment using a simple camera. I have have shot photos of the picture displayed on a LCD monitor in two different cases. In case-1, the camera was still and in case-2 the camera was shaking in a circular arc (in to and fro) about and axis in the vertical plane passing through the centre of the camera. (just as like we shake our head). I did it with hand just as we shake our head. I have given the photos below.

Case-1 (still camera)

**Case-1** (still camera)

Case-2 (shaking camera)

**Case-2** (shaking camera)

It can be observed that the face of Rajini is more clearly visible in Case-2 (shaking camera) than in the Case-1 (still camera) where the face is not clearly visible.

PS : Now there is really no need to shake our head.

Added 2

after a recommendation by Willie, here, I have added Case-3 where the camera is shaking vertically (parallel to the stripes in the picture).

It can be observed that not much of an effect there when camera is shaking parallel to the stripes.

Case-3 (shaking camera vertically)

**Case-3** (shaking camera vertically)

Rajesh D
  • 4,247
  • 1
    What sort of mathematical explanation are you looking for? –  Oct 11 '11 at 15:28
  • 7
    Just for your information, you can also see the photo if you unfocus your vision, no need to shake your head and cause unnecessary headaches. – Asaf Karagila Oct 11 '11 at 15:29
  • 21
    It's not mathematics, it's physiology. They drew a grid of crisp black bars across a faint photograph. In mechanistic language: as long as you see the image clearly, the eyes' built-in edge-detection signal overwhelms everything else, but if you move your head quickly from side to side there isn't time for the edges to be detected, and the vision falls back on average brightness. – hmakholm left over Monica Oct 11 '11 at 15:32
  • 1
    I think that this would make a fine question for the proposal http://area51.stackexchange.com/proposals/4955/popular-natural-science so I invite you to support the proposal. – Phira Oct 11 '11 at 15:36
  • 10
    Actually, if I tilt my LCD screen, I can see the image. No need for head-shaking! – J. M. ain't a mathematician Oct 11 '11 at 15:37
  • @J.M. : you need to look at the image from a bit closer to the monitor. – Rajesh D Oct 11 '11 at 15:39
  • @all : "as long as you see the image clearly, the eyes' built-in edge-detection signal overwhelms everything else, but if you move your head quickly from side to side there isn't time for the edges to be detected, and the vision falls back on average brightness" this seems intuitively correct...but is there any way to give a quantitative and mathematically rigorous explanation for the quoted statement ? – Rajesh D Oct 11 '11 at 15:44
  • That's physics+biology, not mathematics. – J. M. ain't a mathematician Oct 11 '11 at 15:45
  • @all : then what about this question http://math.stackexchange.com/q/11669/2987 – Rajesh D Oct 11 '11 at 15:50
  • 5
    @Rajesh: I fail to see the connection between your question and the one you link to. Music is well-known to have links with mathematics. Optical illusions...less so. – user1729 Oct 11 '11 at 15:55
  • 1
    @Swlabr : If you fail to see a mathematical explanation, someone else might invent one. I do not understand your prejudice ! (between music and vision) – Rajesh D Oct 11 '11 at 15:58
  • 1
    I don't know of a mathematical treatment of this illusion, but you might be interested in a report about a mathematician who does work with optical illusions http://www.deceptology.com/2011/03/optical-illusions-by-kokichi-sugihara.html – Robert Israel Oct 11 '11 at 17:16
  • 1
    @J.M. I think what you describe with tilting the screen has more to do with the physical construction of the LCD screen, which changes the overall brightness/contrast profile of displayed images depending on angle. If you take the initial image Rajesh gave us and apply the Heaviside function to the pixels (turning it from grey-scale to black-and-white), you will also be able to see the face). This, I think, is what happens when you tilt your screen. (BTW, this is also why you shouldn't "trust" what you see on LCD screens if you are in graphics/website design...) – Willie Wong Oct 19 '11 at 13:11

2 Answers2

75

What you are seeing is a physical manifestation of the mathematical operation known as the convolution.

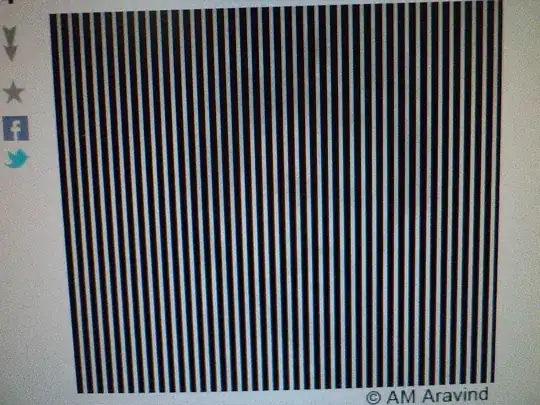
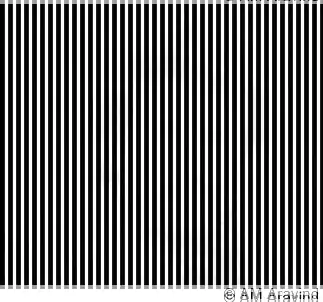
First let me show you some pictures; we'll get into the mathematics afterwards. We start with the original

enter image description here

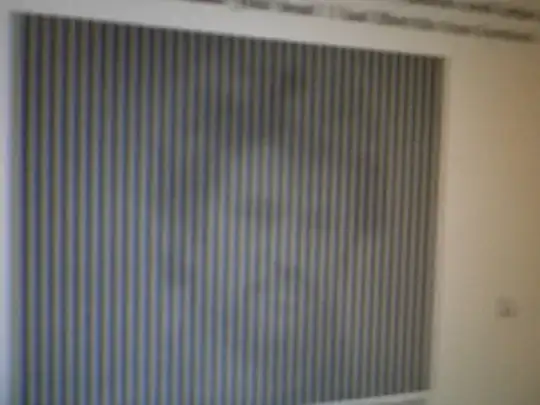
I take the image, desaturated the colours, and duplicated another layer, and pixel-wise added the layers after some translation. With a horizontal translation that is half the "wavelength" of the black bars, we get

enter image description here

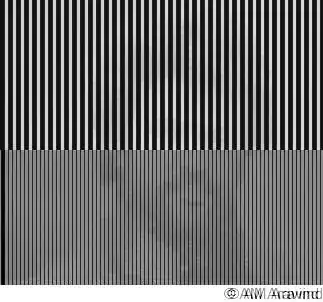
With a translation of the same number of pixels, but vertically, we get

enter image description here

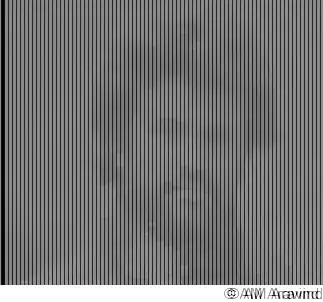
and finally, a diagonal translation at -45 degrees.

enter image description here


So what is going on? Why did I say that this is a manifestation of convolution?

Recall that the convolution of two functions defined on (say) the real line $\mathbb{R}$ is defined to be

$$ f * g (x) = \int_{\mathbb{R}} f(y) g(x-y) dy $$

In a course in Fourier analysis, one is taught to emphasize that this is the dual operation of multiplication. That is, convolution in physical space corresponds to (point-wise) multiplication in Fourier space. This immediately gives the following interpretation of a convolution in signal processing:

Convolving a signal $f$ by a function $\psi$ is the same as applying a frequency dependent filter $\hat{\psi}$ to the signal $f$.

Another way of looking at the convolution, however, after staring at the above definition for a bit, is that

A convolution is a way of taking weighted average of a signal with its translates. The weight depends on the amount of translation.

It is in this second sense that we will first look at the phenomenon you asked above. In the second image of this post, I averaged the signal with its translation horizontally by half the wavelength of the black bars. Hence this is a convolution. Similarly, in the third/fourth image of this post, I averaged the original with a vertical/diagonal translation. They are also convolutions. And you see that this reproduces the observation you made that the direction in which you shake your head/camera produces an effect on the image seen/captured.

So how is the process of shaking your head of shaking a camera a process of convolution? The idea is that the image you see with your eyes and you capture with a camera do not come from photons all emitted at the same instant in time (special relativity notwithstanding). In your vision, there is the well-known phenomenon of persistence of vision which posits that the perceived image is actually made up of photons arriving in a 40 millisecond interval. Similarly, the shutter-speed of a camera determines how long a camera registers light, and so a camera set on 1/25 for the shutter-speed will "open its eye" for 40 milliseconds, and the image registered on the CCD or on film will be photons arriving in that window.

Now, if you shake your head or camera so that the retina or the CCD or the film moves significantly during that 40 milliseconds, each of your retina cell, each of the photoelements on the CCD, or each of the dye pigments on the film will be exposed to photons originating from different spatial positions. (I am grossly simplifying here, but that's the moral of the story.)

To summarise: your eyes and cameras already take convolution of the incoming signal in time when they compose the image. By shaking the apparati you convert the temporal convolution to a spatial convolution. Which means that you are taking a weighted average of the image and its spatial translations, which is why what you see and capture on camera can be analogously described by digitally manipulating the image via an averaging/convolution procedure.

Note that this corresponds somewhat with Henning's comment to your question. The "eye's edge detection" he mentions is, roughly speaking, a description of how the eye is sensitive to different spatial frequencies of a signal (not to be confused with the actual electromagnetic frequencies with determines the colour). By shaking your head you apply a convolution operator, which in frequency space introduces a cut-off for high spatial frequency components. Buy reducing the high spatial frequency components, your eye is forced to get its information from the lower-frequency components in which the image of the Indian Actor hide. (There's some technical inaccuracies in this paragraph about how human physiology works and how it interacts with the shaking of the head, but I think this simpler picture illustrates the idea better.)


At this point I should mention that the idea of taking spatial convolutions of images and the exchange between temporal and spatial convolutions with the motion of the camera is not only useful for optical illusions. It actually has industry application in automatic image deblurring.

Willie Wong
  • 73,139
1

(this is in response to the answer by Willie..I have added this here as i couldn't insert an image in the comments...i hope it is ok in this special case.)

The notion of spatial frequency has been used by Willie in his answer. He mentions that the information pertaining to the face of the actor is present in the lower spatial frequency components, and the stripes correspond to high spatial frequency components. According to his answer, when we shake the head/apparati, we are convolving the picture with a low pass filter with some cut off frequency, and this operation allows only lower spatial frequency components in the final image there by forcing the eye to interpret the information in the lower spatial frequency components which is nothing but the face of the actor.

Here I argue that the notion of spatial frequency is not useful in all circumstances, for example consider an image shown below. The upper half of this image is taken from the original image and the lower half is taken from the second image of the answer by Willie. The second image of the Willie's answer is result of convolving the original image with a low pass filter. Hence it does not contain high spatial frequency components.

The new image formed here is a combination of two images. The upper half contain high spatial frequency components in the form of stripes. The lower half does not contain high spatial frequency components. But if we consider the entire image as one signal then it contains high spatial frequency components. But there are no stripes in the lower half of it and the lower half of the actor's face is clearly visible without any need for head shaking. In order to view the upper half of the actor we still need head shaking. In this case spatial frequency is of no use to characterize the stripes. If there are high spatial frequency components then we can say that there could be stripes, but we cannot say whether they are present only in the upper half or lower half or everywhere. Simply speaking the spatial frequency notion cannot give any information about where the stripes are present in the image. But the human eye does so well that it can see the face in the lower half of the image where the stripes are not present !

enter image description here

Rajesh D
  • 4,247
  • actually, the one thing you didn't take into account is that in your case you can do separation of variables. In essence the shaking of head in one preferred direction means that your are convolving against a function which is constant in the complementary direction. In other words, you are only taking a frequency filter in the $x$ direction, applying to one constant $y$ slice at a time.... – Willie Wong Oct 19 '11 at 19:37
  • @Willie : I am not able to get what intended in your comment in the current context. I agree that here the stripes only in one direction are considered. But my point of argument is not about the direction of stripes or the separability of variables and i deliberately want to keep this issue aside and consider only the case of vertical stripes. I intend to say that the presence of stripes is indicated in the Fourier spectrum of the signal (my argument applies irrespective of the dimensionality of the signal) by the presence of high frequency components....... – Rajesh D Oct 21 '11 at 04:09
  • ...But the Fourier spectrum does not give any idea of where the stripes are present. (whether everywhere are only at certain locations). But from the figure i've posted, it can be seen that the presence of stripes affect the vision only ate the vicinity of location where the stripes are present. The bottom half of the picture is still clear even though the stripes are present in upper half. This localization property is not evident from the use of Fourier transform and hence the explanation using Fourier transform and convolution, in my opinion does not give the full picture. – Rajesh D Oct 21 '11 at 04:12
  • what you are looking at is related to microlocalisation and separation of variables. The latter I already explained up top: if you take only the Fourier transform in the $x$ variable, you will see that you have functions $\tilde{f}(\xi,y)$ where the "high frequency" components from the black bars only occur for certain $y$. But more importantly, you see to be assuming that I meant that your eye is taking the two-dimensional Fourier transform of the signal and applying some sort of filter to it, when that is not at all what is meant. The point is that the "persistence of vision" allows – Willie Wong Oct 21 '11 at 05:42
  • certain "time integrals" be expressed equivalently as certain "space integrals" which can then be seen to be a convolution, which has a Fourier space interpretation. But the convolution can be taken to be a purely physical space phenomenon, and I mentioned the Fourier space interpretation only to show you the two sides of the same coin: in this case it (weightly) averages pixels with nearby ones. I don't see how your picture does anything to contradict that. – Willie Wong Oct 21 '11 at 05:45
  • Part of the point of my post was precisely that in Fourier/signal analysis, you can often look at the same problem fro the Fourier side and the physical side: they are equivalent mathematically, but psychologically it is sometimes easier to see and understand what is happening from one side rather than the other. In this case, it is vastly easier to understand the convolution from the physical side than to try to see what's going on purely from the spectrum. – Willie Wong Oct 21 '11 at 06:03
  • @Willlie : " the convolution can be taken to be a purely physical space phenomenon....it (weightly) averages pixels with nearby ones", My image does nothing to contradict this statement. The problem is with the Fourier space interpretation. I quote "The "eye's edge detection" he mentions is, roughly speaking, a description of how the eye is sensitive to different spatial frequencies of a signal". You seem to have brought in the Fourier space interpretation to explain the stripes obscuring the face. ... – Rajesh D Oct 21 '11 at 06:24
  • Again here, "your eye is forced to get its information from the lower-frequency components in which the image of the Indian Actor hide". While trying to separate the stripes as high frequency components, you are actually losing the spatial localization of the stripes. This interpretation is not complete, although you are able to explain the phenomenon in this case. – Rajesh D Oct 21 '11 at 06:24
  • @Willie : do you think there got to be another mathematical explanation, which does help psychologically to explain this phenomenon with out jumping from Fourier and physical domains for explain different things of the same phenomenon ? – Rajesh D Oct 21 '11 at 06:32
  • @Willie : please let me know if my last few comments are irrelevant in the correct context. – Rajesh D Oct 22 '11 at 04:47
  • you seem to be under the impression that your eye actually sees things by analysing the Fourier space representation of the signal. I make no such assumptions about human physiology. Nor do I write about psychology. (Read that last parenthetical in the paragraph you quoted from.) Let me point out one last thing that is suspect about your logic: in both pictures (yours above and the original) you have a mix of "high frequency, high amplitude" and "low frequency, low amplitude" signals. The mathematical description of what is happening is simply that if you filter away the high freq. – Willie Wong Oct 29 '11 at 16:50
  • signals, all that's left is the low freq ones. Without a "high amplitude" signal to compare again, it is meaningless to say whether what remains has a high or low amplitude. But this certainly does not mean that every time you add a "high amplitude high frequency" signal you will immediately destroy your ability to discern the "low amplitude low frequency" signal. Conspiratorial cancellations are certainly allowed to happen. – Willie Wong Oct 29 '11 at 16:55
  • @Willie : Why is it that you want to attribute the stripes to high frequency, by attributing in this way you actually imply their presence everywhere in the image...as 'frequency components' mean sinusoids which have support everywhere.....my question is only about this attribution.......nothing about anything from the original question or your original answer. – Rajesh D Oct 29 '11 at 17:25
  • ah! I see what you are getting at now. Simple answer: what I mean by "high frequency signal" is emphatically not just a signal with frequencies restricted to a range of high frequencies. What I meant is a signal whose Fourier decomposition has much larger (larger taken in a suitable sense) high frequency components than low frequency ones. High and low here are relative, and not absolute. You should think of a high frequency signal as one that would become much weaker (not necessary vanishing) after passing through a low pass filter. – Willie Wong Oct 31 '11 at 12:51
  • Take a one dimensional example: compared to the Gaussian $G(x) = e^{-x^2}$, the signal $\sin(1000 x) G(x)$ is a high frequency signal, as its Fourier transform has most of its mass far away from the origin. – Willie Wong Oct 31 '11 at 12:54
  • @Willie : Thanks for the clarification....I am accepting the answer with +1; :-), i agree that your answer is the state of the art but i like to think that it is still an open problem ! – Rajesh D Oct 31 '11 at 13:45