3

$k$ balls are uniformly and independently placed into $n$ bins. Sort the bins in ascending order. Is there a general formula for the expected number of balls in the $i$th ordered bin?

I don't really have an idea for how to approach this. I only got as far as figuring out that the probability of an arbitrary bin containing $m$ balls is $(1/n)^m (1-1/n)^{k-m} {k \choose m}$. I worked out the case for $n=2$, but that's so trivial I doubt it would help with a general solution.

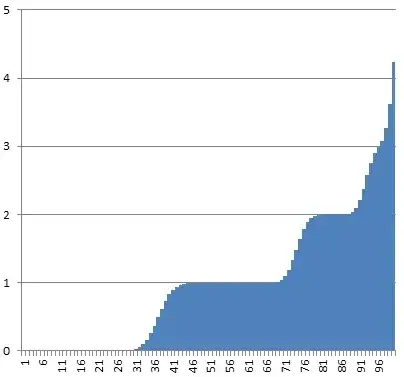
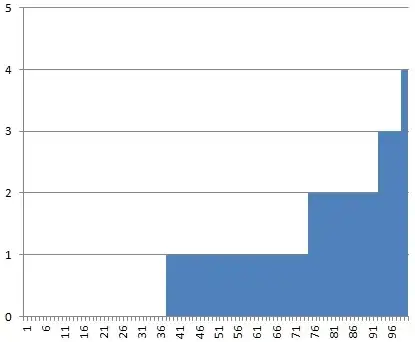
The graph of the formula in question looks pretty interesting. X-axis is $i$, Y-axis is expected value of $i$th bin, for $k=100$ and $n=100$. I generated it by averaging 10,000 random placements.

Bucket size by nth smallest

ebsddd
  • 459
  • What probability distribution are you assuming for your $x_i$? Are they integers? – Robert Israel Dec 20 '13 at 17:26
  • @RobertIsrael Yes, $x_i$ are integers; I've added clarification for that. The probability distribution uniform is over all sequences that match that criteria (not over the $x_i$s). – ebsddd Dec 20 '13 at 17:39
  • @valtron I don't see any implementation of the constraint $\sum x_i=k$ in your pmf????? – wolfies Dec 20 '13 at 18:18
  • @wolfies Sorry, "pmf"? – ebsddd Dec 20 '13 at 18:23
  • @valtron Probability mass function ... which you state as: $P(x_i=m)$ is $(1/n)^m (1-1/n)^{k-m} {k \choose m}$ – wolfies Dec 20 '13 at 18:25
  • @wolfies I derived that like so: start with $[0, ..., 0]$ and add k $1$s, each at an independently random position. The resulting sequence satisfies the constraint by construction. The probability that position $i$ is $m$ is the probability that you put $m$ of the $1$s there ($1/n$) and $k-m$ not there ($1-1/n$). $k \choose m$ accounts for the number permutations of m $1$s in position $i$. (Also note that $x_i$ and $x_j$ are not independent.) – ebsddd Dec 20 '13 at 18:35
  • 2
    This is an interesting and, I think, fairly difficult question. The expected value of the largest element (with the roles of $n$ and $k$ switched) is given in exact and approximate form by my answer here. Finding an expression for the $N$th largest will be much harder, I think. – Mike Spivey Dec 20 '13 at 18:35
  • @MikeSpivey Thanks. The term "random composition" is also something I was looking for. Maybe I'll be able to google something. – ebsddd Dec 20 '13 at 18:39
  • @valtron So, to make things concrete ... if $k=4$ and $n=3$, the set of possible sequences is Compositions[4,3], namely the 15 sequences: {{0,0,4}, {0,1,3}, {0,2,2}, {0,3,1}, {0,4,0}, {1,0,3}, {1,1,2}, {1,2,1}, {1,3,0}, {2,0,2}, {2,1,1}, {2,2,0}, {3,0,1}, {3,1,0}, {4,0,0}} ... and you attach equal probability to each sequence occurring ... Is that a correct description of your set-up? – wolfies Dec 20 '13 at 18:50
  • @wolfies Ah. I didn't notice this key point, I apologize. The probability of each sequence is proportional to $k!/\prod x_i!$ – ebsddd Dec 20 '13 at 18:54
  • @wolfies I added the root problem I'm trying to solve; it might explain things better. – ebsddd Dec 20 '13 at 19:03
  • The distribution is a multinomial, right? Related: http://mathoverflow.net/questions/104948/distribution-of-maximum-of-a-uniform-multinomial-distribution – leonbloy Dec 20 '13 at 20:03
  • 1
    This seems to have been studied here: http://epubs.siam.org/doi/abs/10.1137/1116007 – leonbloy Dec 20 '13 at 20:30
  • 1
    I think the OP could do a much better job expressing the question clearly, and providing a simple example (say Compositions[4,3]) with the probability he is attaching to each sequence. Based on the OP's revision 3 comments above that the probability is not Uniform, but proportional to blah ... this does indeed appear to be a standard textbook Multinomial, with equal probabilities $p_1 = p_2 = ... = p_k$ – wolfies Dec 21 '13 at 14:59
  • @wolfies Yeah, in the process of analyzing it I ended up turning it into a pretty horrible question. Fixed now. – ebsddd Dec 22 '13 at 09:04

1 Answers1

0

Given that the formula for the expected value of the largest element is so complicated, it's unlikely there's an exact formula for the $i$th smallest.

So, as far as approximations go, it turns out $p(m)=(1/n)^m(1-1/n)^{k-m} {k \choose m}$ is key to approximating the formula that produces that graph:

$$\mathbb E[\text{number of balls in }i\text{th bin}] \approx \min \, \{\,M \mid \frac{i-\epsilon}{n} \le \sum\limits_{m=0}^M p(m)\,\}$$

I added $\epsilon \in (0,\frac{1}{2}]$ because otherwise $\mathbb{E}[n]=k$, which is very wrong for large $k, n$.

Graph of approximation corresponding to $n,k=100$:

enter image description here

ebsddd
  • 459