3

Three points $A$, $B$, $C$ are chosen randomly on a circle. Let us consider angles $\alpha$, $\beta$, $\gamma \in [0, 2\pi)$ formed by consecutive pairs of points. Angles are reordered from the smallest to the largest: $\alpha^* \le \beta^* \le \gamma^*$. For given number $x \in \mathbb{R}$ I need to find the probability $P(\beta^* \le x)$.

There are some questions here (this and this) considering same three-point-on-a-circle problems but I don't know what to do with the reordering step. I can start from point $A$ and now three point configuration can be considered as a uniformly distributed point in $[0,2\pi)$ square ($B$ is one axis and $C$ is on another). But now I need to somehow apply the reordering and this is where I stuck.

I've run simple simulation and plotted CDF. Got something like thisCDF of second larger angle

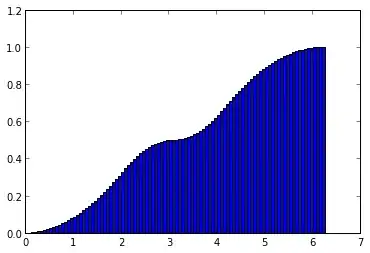
Still no ideas though.

EDIT: Simulation code (in Python) for single experiment:

def experiment():
    x1 = 2*math.pi*random.random()
    x2 = 2*math.pi*random.random()
    x3 = 2*math.pi*random.random()
    angles = [x1 - x2, x2 - x3, x3 - x1]
    for i in range(len(angles)):
        if angles[i] < 0:
            angles[i] += 2*math.pi
    angles.sort()
    return angles[1]
Boris
  • 193
  • Your weird behavior of the histogram might be because you're considering that $\alpha, \beta, \gamma$ form three angles. But really, the three points only form two angles, with one of the angles being a compliment. Consider instead only the angles between $\alpha$ and $\beta$, and $\alpha$ and $\gamma$ (or $\beta$ and $\gamma$), since the remaining angle is completely determined by the first two you pick. – Emily Dec 03 '13 at 17:18
  • @Arkamis hm, I've tried to do simulation by the statement: generate three angles $\in [0,2\pi)$, calculate differences between consecutive angles, add $2\pi$ if angle is less than $0$, sort angles, return middle one – Boris Dec 03 '13 at 17:25
  • @Boris, sorry for offtopic, but what libraries have you used to draw the histogram? – tenpercent Dec 03 '13 at 21:01
  • @tenpercent I believe it is matplotlib. But I just used it from inside pylab (ipython notebook --pylab=inline from console window) – Boris Dec 04 '13 at 04:04

1 Answers1

1

It is not clear what you mean by angle "formed by a pair of points". I assume you mean angle subtended at the center. Fix point A, generate independent random variables $b$ and $c$, uniformly distributed over $(0,2\pi)$ for anticlockwise angular separation of B and C from A. The three angles are $\min(b,c),|b-c|$, and $2\pi-\max(b,c)$. By symmetry, each of these three angles is equally likely to be the middle angle (not smallest or largest) so we can calculate the CDF of $\min(b,c)$ conditional on it being the middle angle. For the joint probability that $\min(b,c)<x$ (where $0\le x\le \pi$) and $\min(b,c)$ is the middle angle, we calculate the probabilities of four cases:

  1. $b<x,b<c<2b,c<2\pi-b$
  2. $b<x,c>2b,c>2\pi-b$
  3. $c<x,c<b<2c,b<2\pi-c$
  4. $c<x,b>2c,b>2\pi-c$

Cases 3 and 4 have same probability as cases 1 and 2 so let us calculate probabilities of 1 and 2. Conditional on $b<x$, we must have $b<c<\min(2b,2\pi-b)$ or $c>\max(2b,2\pi-b)$. The probability of that is $\frac{\min(2b,2\pi-b)-b+2\pi-\max(2b,2\pi-b)}{2\pi}$ or $\frac{2\pi-b-|2\pi-3b|}{2\pi}$.

The combined probability of cases 1 to 4 is then $\int_0^x \frac{2\pi-b-|2\pi-3b|}{\pi} \frac{\mathrm{d}b}{2\pi}$.

The probability that $\min(b,c)$ is the middle angle is $1/3$ so the conditional probability is obtained by dividing the joint probability by $1/3$. The required CDF is $3\int_0^x \frac{2\pi-b-|2\pi-3b|}{\pi} \frac{\mathrm{d}b}{2\pi}$.

If $x \le 2\pi/3$, the CDF is $3\int_0^x \frac{2\pi-b-(2\pi-3b)}{\pi} \frac{\mathrm{d}b}{2\pi}=\frac{3x^2}{2\pi^2}$.

If $2\pi/3\le x \le \pi$, the CDF is $3\int_0^{2\pi/3} \frac{2\pi-b-(2\pi-3b)}{\pi} \frac{\mathrm{d}b}{2\pi} + 3\int_{2\pi/3}^x \frac{2\pi-b+(2\pi-3b)}{\pi} \frac{\mathrm{d}b}{2\pi} = \frac{6\pi x-3x^2-2\pi^2}{\pi^2}$.

One problem with the Python code is that given any two points on the circle, there are two possible angles between them (adding up to $2\pi$). The correct angle is determined by the position of the third point. Because of this problem, you have CDF increasing beyond $\pi$ the maximum possible value of the middle angle. Before you sort angles, you should add lines like:

if (x1-x3)*(x2-x3) < 0:
        angles[0] = 2*math.pi - angles[0]
if (x2-x1)*(x3-x1) < 0:
        angles[1] = 2*math.pi - angles[1]
if (x3-x2)*(x1-x2) < 0:
        angles[2] = 2*math.pi - angles[2]
user96614
  • 1,656
  • Thanks. I've modified Python code to sort generated points to have complementary angles. Resulting histogram behaves exactly as your analytical CDF function. – Boris Dec 03 '13 at 20:30