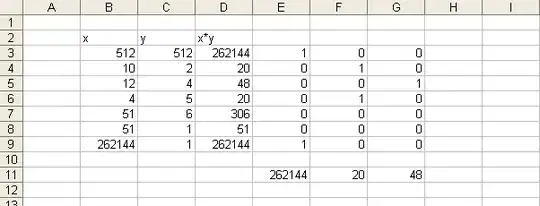
I have an excel file with 8083 X and Y columns.
The first column represents the name of the image I have, and the other column represents the multiplicaltion reusult of the (x,y) resolution of that image (i.e; (512,512) -> 262144.
Now, in this case, I will have an image name and a result beside it.
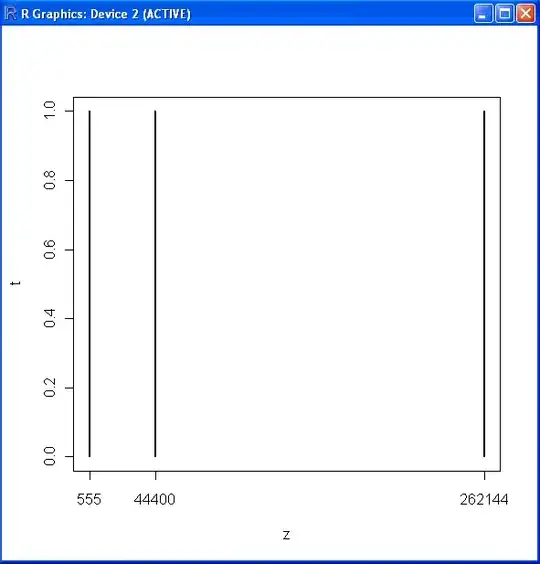
I'm trying to plot a graph that gives me the number of images that equal for example 262144.
So, I will have an x-axis with representing the "resolution" multiplication result, and a "y-axis" representing the "Number of images".
Is there a software program that enables me to get such graph? Provided that, again, I have 8083 records.
Thanks.