I am taking machine learning, and I have seen a few contour plots in the course.
It seems that I can't understand how to read this plot, I have tried looking it up in Wikipedia, but I don't even understand the first example (the figure on the right).
Another example is from the course:
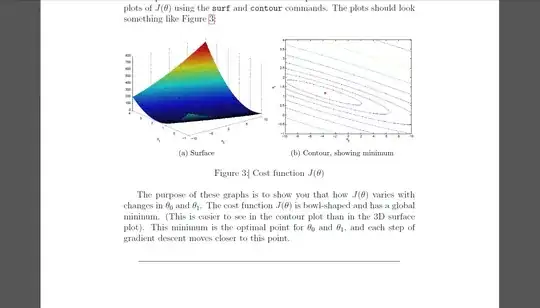
The remark in the brackets say that it is easier to see that the function plotted is convex from the counter plot. but I don't see it at all.
What are those circles ? what is the meaning that the red x is in the inner circle (or even near its middle) ?
I would appreciate it if someone could please explain what information I should be able to read from the right drawing (the contour plot) and how ?