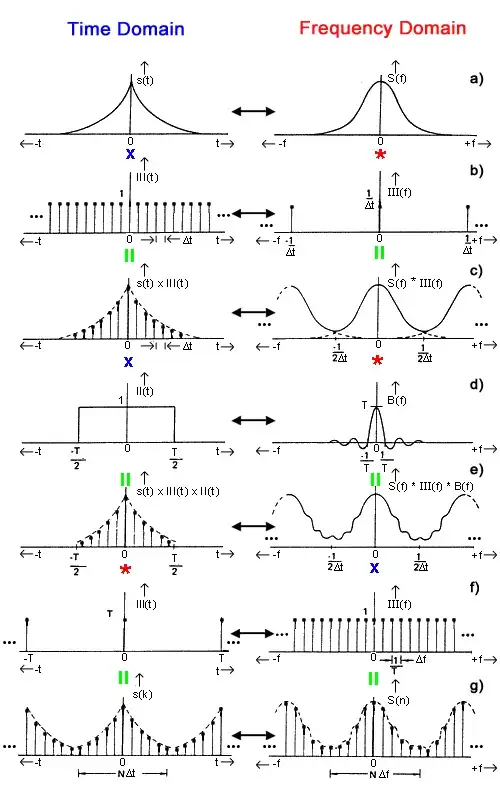
I would like to know why the graphs below are symmetrical around x = 0. How can signals exist at a negative point in time or frequencies be negative? Does this have something to do with the complex nature of fourier transforms? Like, the only way to plot them in the real domain is to make the functions even by adding a non-existent symmetrical part along the negative side of the axis? If this is the case, should we just ignore all negative values and concentrate on the right side of each graph if we want to intperpret what we see on such a graph?
Asked
Active
Viewed 4,181 times
5
-
http://math.stackexchange.com/questions/184332/fourier-transform-of-even-odd-function – dls Sep 12 '13 at 05:23
2 Answers
2
Think of it as a spinning wheel, where a positive frequency means that the wheel is spinning counter clockwise (positive in a coordinate system) while a negative frequency means that the wheel is spinning the other way.
the wheel can be described as $e^{i \theta}$ and if $\theta$ increases, we move counterclockwise but if $\theta$ decreases or if we write $e^{-i \theta}$ it goes clockwise instead

Noxet
- 760
0
Frequency is nothing more nor less than the multiplier of theta in the trigonometric expression $ \sin(\theta)$ or $ \cos(\theta)$.
Due to the closure of R under multiplication, it can take on any value in the domain of those trigonometric functions, which is again all of R.

Pieter Geerkens
- 901