2

I've been working on a tool to turn photos of graphs into digital data (I know there are already tools out there, I wanted to understand the mechanism and I find learning by doing the easiest), but I cannot get my head around the maths involved.

I've had a bit of a read and I think I understand the matrix stuff involved in affine transformations, but I seem to be at a bit of a roadblock with projections, which is what I think I need (but could be wrong there too).

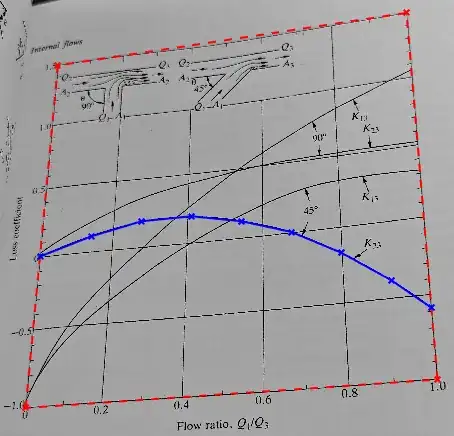
I've got the following image and I know the pixel coordinates of the axes (red) and the data that I want to extract (blue). I also, obviously, know the axis limits that I need to transform the data to.

Graph with points displayed

What I cannot work out at all is how to do that transformation! If anyone has any advice for how to understand how to get from the projected image to an un-projected set of data I would be massively appreciative.
  • This does not seem to fit the usual projective geometry scheme of projecting onto a viewing plane (or, in this case, line). I don't see why you expect this to come from a linear model. In any event, perspective projections are not affine transformations. There are lots of books on computer graphics, but I have a very brief discussion of perspective projection matrices on pp. 322-325 of Linear Algebra: A Geometric Approach. But, again, I don't see how this applies. – Ted Shifrin Dec 19 '23 at 18:48
  • Hi @TedShifrin - I did say I could be wrong in my question, so thanks for confirming. I'd assumed I'd found the right thing as I thought that straightening up the graph images would be no different to straightening up architectural photos which I believe they use homography for, but I must have not quite understood. Do you have any ideas of where would be a good place to look next? – Laurengineer Dec 23 '23 at 20:36
  • I truly do not understand what your image is depicting. I just said it doesn't look like projection in any sense that I can think of (whether linear algebra or projective geometry). – Ted Shifrin Dec 23 '23 at 20:47

1 Answers1

0

This is answered very eloquently here and so this is the method I've used to solve the problem I'm having, demonstrated below (without the maths).

I've gone from the following projected graph of a known curve that I created, so that I can test my maths:

With the data points for the axes used to map the transformation of the axes and data:

I used the transformation matrix between the marked up axes and the axis limits on the image to obtain the marked up data points' "real" values, as compared to a plot of the known curve:

Obviously the points I've selected might not be dead on so any error is more likely due to that than numerical errors.