I'm referring to the book: "Grinstead and Snell’s Introduction to Probability", and quoting a problem from the book,
Example 1.4 (Heads or Tails) For our next example, we consider a problem where the exact answer is difficult to obtain but for which simulation easily gives the qualitative results. Peter and Paul play a game called heads or tails. In this game, a fair coin is tossed a sequence of times—we choose 40. Each time a head comes up, Peter wins 1 penny from Paul, and each time a tail comes up Peter loses 1 penny to Paul. For example, if the results of the 40 tosses are THTHHHHTTHTHHTTHHTTTTHHHTHHTHHHTHHHTTTHH. Peter’s winnings may be graphed as in Figure 1.1 A second interesting question about this game is the following: How many times in the 40 tosses will Peter be in the lead? Looking at the graph of his winnings (Figure 1.1), we see that Peter is in the lead when his winnings are positive, but we have to make some convention when his winnings are 0 if we want all tosses to contribute to the number of times in the lead. We adopt the convention that, when Peter’s winnings are 0, he is in the lead if he was ahead at the previous toss and not if he was behind at the previous toss. With this convention, Peter is in the lead 34 times in our example. Again, our intuition might suggest that the most likely number of times to be in the lead is 1/2 of 40, or 20, and the least likely numbers are the extreme cases of 40 or 0.

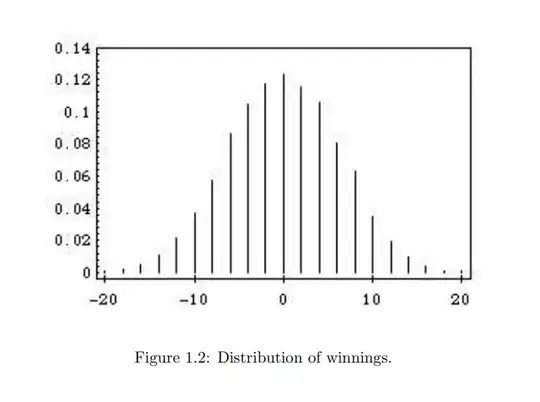

Now a simulation is run for 10000 tosses, and the distribution of winnings of Peter and how many times Peter was in lead is shown in spike graphs (Figure 1.2 & Figure 1.3 respectively). Also, the simulation of the game for 1000 and 10000 plays is shown in (Figure 1.4 & Figure 1.5 respectively). 

Now it is clear to me that Peter will be in the lead most probably for 0 or the maximum (10000) tosses. But how does this simulation conclude that Peter's winning will be eventually 0. If Peter's winning does not come to 0 in 10000 tosses, how could we conclude that
It is a remarkable fact, however, that, if play is continued long enough, Peter’s winnings will continue to come back to 0, but there will be very long times between the times that this happens.