Earlier , when I saw this Question , I got the Answer $0.5$ but was hesitant to Post it , because the Simulation by OP was getting $0.45$ limit. With user "Jeroen van der Meer" & user "Dstarred" confirming $0.5$ limit , I think I can safely Post my Analysis.
(1) Shortest 3 Consecutive Pieces :
Let the Stick be broken & the Pieces arranged by Size.
Take the Shortest 3 Consecutive Pieces $(X,Y,Z)$ where $X \le Y \le Z$.
We want $X+Y \ge Z$
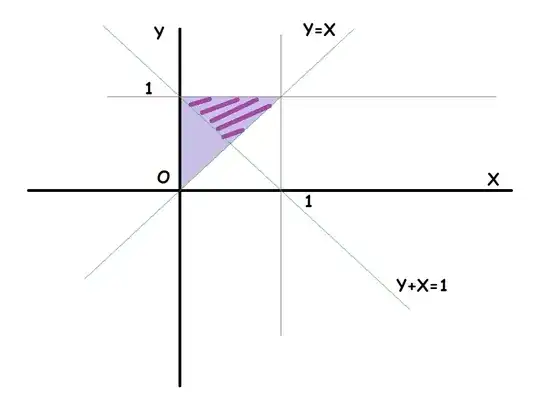
We can scale these ( by Dividing throughout by $Z$ ) to get $(x=X/Z,y=Y/Z,z=Z/Z=1)$
What we now want is :
$x+y \ge 1 \tag{C1}$
where
$x \le y \le 1 \tag{C2}$
[[
OBSERVATION 1 : In Case , we have the additional Criteria :
$X+Y+Z = Constant \tag{??C3??}$
then it is equivalent to this Case , where Probability is $1/4$ , though that Criteria is not valid here in the limiting Case.
]]
That Shaded Area ( larger triangle ) is satisfying (2) , while that Highlighted Area ( Smaller triangle ) satisfies (1) , hence that will give the necessary Probability $P=0.25/0.5=0.5$ , matching the Simulations.
[[
OBSERVATION 2 : Simulation Probability is moving from the Initial Case where we have the additional Criteria (C3) to the limiting Case where that Criteria (C3) is irrelevant. The Simulation is moving from $0.25$ ( $n$ close to $3$ ) to $0.5$ ( $n$ very large ) gradually.
]]
(2) Some 3 Consecutive Pieces , not necessarily the Shortest , not necessarily the longest :
Let the Pieces be $P_1,\cdots,P_n$ arranged by Size.
When $(P_1,P_2,P_3)$ can give the triangle , Probability is $P=1/2$.
When $(P_1,P_2,P_3)$ can not give the triangle , it is $(1-P)=1/2$ & we can check $(P_2,P_3,P_4)$ , $(P_3,P_4,P_5)$ , $(P_4,P_5,P_6)$ , $(P_5,P_6,P_7)$ , ETC.
Thus total Probability is $P + P \times (1-P) + P \times (1-P)^2+P \times (1-P)^3\cdots=P/(1-(1-P))=1$
Amazingly , we can guarantee a triangle somewhere among 3 Consecutive Pieces in the limiting Case , no matter what $P$ is !
In other words : (A) If we want acute-angled triangle with some non-Zero Probability , then we can guarantee that among 3 Consecutive Pieces when $n$ is very large. (B) If we want obtuse-angled triangle with some non-Zero Probability , then we can guarantee that among 3 Consecutive Pieces when $n$ is very large. (C) If we want all irrational sides of the triangle with some non-Zero Probability , then we can guarantee that among 3 Consecutive Pieces when $n$ is very large. Necessary Criteria is that $P$ must be non-Zero.

 $n = 100$" />
 $n = 10$" />