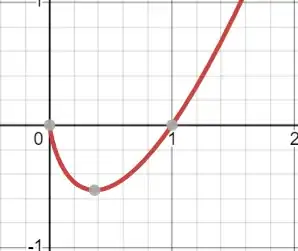
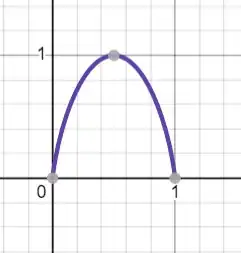
I can understand it algebraically, but I wanted some geometric-esq intuition for why the graph is this way. Like some intuition that I could've used to derive it.
This is the plot:
I eked out some explanation for what's happening (not sure how correct it is):
A log:
We want it to swoop back in to zero instead of going to -infinity though. So, we weight it by $x$ (which gets smaller as it goes to $- \infty$
Flip it
Now copy it, flip horizontally, and push it to 1 (since we want the graph to be from 0 to 1).
My brain is happy with everything above, what it isn't happy with is that when I add both of them together: the part in the middle gets added as expected but the parts at the ends just go away? What witchcraft is this?


Another nice property, suppose you have a set of cardinality $n$, and you want to know how many subsets of cardinality $k$ are there, with $p=\frac{k}{n}$. We know this is ${n \choose k}$, but we can also give a nice asymptotic approximation with $2^{n H(p)}$, or even some bounds as shown here. – Kolja Jun 05 '23 at 06:53