1

For the purposes of simplicity, I am considering 2 variables here:

I will be considering Player to be a person rolling 1dN exploding die, where N can equal 4, 6, 8, 10, 12, 20. With the help of @peterwhy in my previous post (https://math.stackexchange.com/a/4473595/1068076), I was able to come up with the equation $P_1(x,n)=\left \{ (x>0)\wedge (x \textrm{ mod }n>0):\left(\frac{1}{n}\right)^{\left(1+\left \lfloor \left ( \frac{1}{n} \right ) \right \rfloor\right)},0 \right \}$ to calculate the probability of rolling a value $x$ on an $n$-sided exploding die.

I will be considering Dealer to be a person rolling 2d10, both of which can explode. Again, thanks to @peterwhy, the equation $P_2(x,n)=\sum_{i=1}^{x}P_1(i,n)P_1(x-i,n)$ defines the probability of rolling value $x$ on 2 $n$-sided exploding dice. $$$$ I need to calculate the probability of success for 3 different situations involving these variables:

Situation 1 - Success occurs when Player rolls higher than Dealer.

Situation 2 - Success occurs when Player rolls lower than Dealer.

Situation 3 - Success occurs when Player rolls equal to Dealer.

So far, I've been attempting to calculating the probability by using the AND principle ($P(x \textrm{ and } y)=P(x)\cdot P(y) $) using summation equations for $x$ an $y$, but those only gave me the probability of success if the Player rolled that value (but even those didn't work properly because I believe they only calculate the probability of this event occurring). The equations I came up with are as follows: $$\textrm{Situation 1: }P_>(x)=\sum_{i=x}^{100}P_1(i,n)\cdot\sum_{j=0}^{x-1}P_2(j,10)$$ $$\textrm{Situation 2: }P_<(x)=\sum_{i=0}^{x-1}P_1(i,n)\cdot\sum_{j=x}^{100}P_2(j,10)$$ $$\textrm{Situation 3: }P_=(x)=P_1(x,n)\cdot P_2(x, 10)$$

Does anyone know what I can do to find the probability of success for each die and situation?
1 Answers1

1

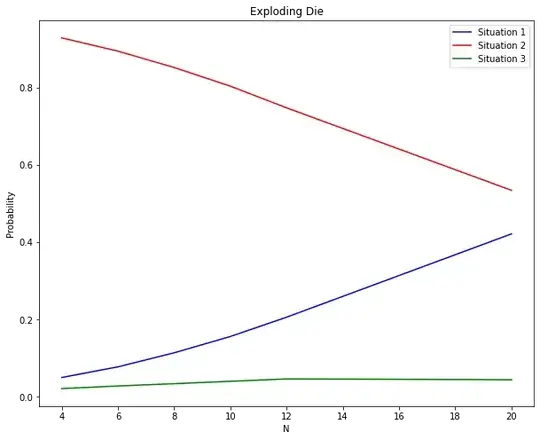
While this is not an analytical solution, a numerical simulation can help. I ran 10 million simulations and these are the results:

                   4         6         8         10        12        20
Situation 1  0.050170  0.077708  0.114014  0.156185  0.206081  0.421487
Situation 2  0.928287  0.894013  0.851738  0.803438  0.747417  0.534200
Situation 3  0.021544  0.028279  0.034248  0.040377  0.046502  0.044314

enter image description here

Below is the Python code performing these simulations efficiently with NumPy vectorization:

import numpy as np
from numpy.random import randint

def player(N, iters): total = randint(1, N + 1, iters) n_rolls = 1 explodes = total == n_rolls * N # Iterations where only explosions happened until now while ( explodes ).any(): total = total + np.where(explodes, randint(1, N + 1, len(explodes)), 0) # Substituting in these locations n_rolls += 1 # Updates maximum total number of rolls explodes = total == n_rolls * N # Updates ongoing explosions return total

def dealer(iters): return player(10, iters) + player(10, iters)

def simulation(iters): res = {} for N in (4,6,8,10,12,20): res_player = player(N, iters) res_dealer = dealer(iters)

    situation_1 = np.mean( res_player &gt; res_dealer )
    situation_2 = np.mean( res_player &lt; res_dealer )
    situation_3 = np.mean( res_player == res_dealer )
    res[N] = {'Situation 1': situation_1,
              'Situation 2': situation_2,
              'Situation 3': situation_3
             }
return res

sim_results = simulation(10000000)

Edit: Code for the graphs

import matplotlib.pyplot as plt
import pandas as pd

df = pd.DataFrame(sim_results)

plt.figure(figsize=(10,8)) plt.title("Exploding Die") plt.plot((4,6,8,10,12,20), df.T['Situation 1'], label = 'Situation 1', color = 'blue') plt.plot((4,6,8,10,12,20), df.T['Situation 2'], label = 'Situation 2', color = 'red') plt.plot((4,6,8,10,12,20), df.T['Situation 3'], label = 'Situation 3', color = 'green') plt.legend() plt.ylabel('Probability') plt.xlabel('N') plt.show()

  • 1
    This is incredibly useful! Did you use anything other than NumPy to generate the graph? – Ben Craven Jun 17 '22 at 16:34
  • 1
    I used matplotlib for the graphs. I included the code to generate the graphs in an edit in my answer. Also, in the table one of the columns was labeled 5 instead of 6 for $N=6$. – econbernardo Jun 17 '22 at 18:10
  • Say I wanted to add a probability of each situation occurring (Situation 1 is 1/3, Situation 2 is 1/2, and Situation 3 is 1/6). Would I have to add the weight to the returned values in sim_results, or would I add it somewhere else? – Ben Craven Jun 17 '22 at 19:46
  • You could do something like: res[N] = {'Situation 1': (1.0/3) * situation_1, 'Situation 2': (1.0/2) * situation_2, 'Situation 3': (1.0/6) * situation_3 } replacing the definition of res[N] inside the simulation function. – econbernardo Jun 17 '22 at 20:14