Let $f(x)$ be the complex-valued function defined by $$f(x)=\sum_{n=1}^{\infty} \frac 1 {(n + x \cdot i)^2}$$ in the real variable $x$, being $i$ the imaginary unit.
Clearly, $$f(0)=\frac {\pi^2} 6$$
Further, $$f(x)=\sum_{n=1}^{\infty} \frac {n^2-x^2} {(n^2+x^2)^2} - 2x \cdot i \sum_{n=1}^{\infty} \frac {n} {(n^2+x^2)^2}$$ therefore $$f(-x)=\overline{f(x)}$$
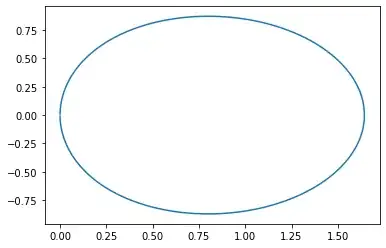
If one plots the values of $f(x)$ in the complex plane, at a first look the result is quite similar to a circle $(|x| \lt 100)$
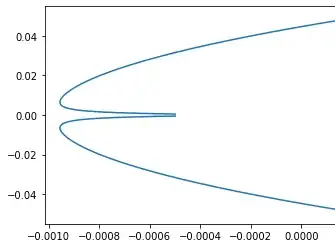
But a closer analysis shows the following behavior for large values of $|x|\;(20 \lt |x| \lt 1000)$
I ask if there are theoretical references that explain the graphs obtained.

