0

Imagine two events $A$ and $B$ that are not mutually exclusive, such that $P(A) = 0.3$ and $P(B)=0.4.$ Consider the Venn diagram of the two overlapping sets, and visualize moving them closer together or further apart, thus varying the size of the overlapping region $A \cap B$. It should be $\color{darkorange}{\text{clear}}$ that $P(A \cap B)$ could take on any value between $0$ and $0.3$, but of that infinite set of possible values, the only one that would make $A$ and $B$ independent would be $P(A \cap B) = 0.12.$

After reading this answer (excerpted above), I drew Venn diagrams below for $P(A \cap B) =0$ (when $A$ and $B$ are disjoint), $P(A \cap B) =0.12,$ and for $P(A \cap B) =0.3$ (when $B \subsetneq A)$.

However, it is $\color{darkorange}{\text{not clear}}$ to me that the only one that would make $A$ and $B$ independent would be $P(A \cap B) = 0.12$. I still can't intuit or visualize independence.

enter image description here

ryang
  • 38,879
  • 14
  • 81
  • 179
  • 1
    Essentially, you want $B$ to be proportionally as big in $U$ as $A\cap B$ is in $A$. In other words, since $40$ percent of $U$ belong to $B$, you also want $40$ percent of $A$ to belong to $B$. – Zuy Dec 30 '21 at 08:21

3 Answers3

3

It's not feasible to represent independence. Most people think drawing Venn Diagrams that are disjoint demonstrates independence, but that is false. If two events are disjoint, they are inherently dependent. Because if I know A occurs, I know B cannot occur and vice versa.

So what about the opposite: drawing Venn Diagrams that intersect? This method isn't quite useful for visualizing independence either. For example, let A be the event Susan studies for her test and let B be the event Susan eats chocolate. The intersection in the Venn Diagram means that Susan studies for her test and she eats chocolate. Let's say these two events are independent. That doesn't mean these two events can't co-occur, i.e. intersect. They can. Likewise, let's say the events are dependent. They can still co-occur or not co-occur. So there, we have shown that we can't demonstrate independence via intersection either.

0

enter image description here

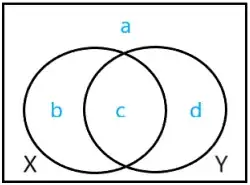
In the above universe, $a,b,c$ and $d$ denote probabilities. \begin{align}&\text{events }X \text{ and } Y \text{ are }\textbf{independent} \\\iff &P(X\cap Y)=P(X)P(Y) \\\iff &\frac{c}{a+b+c+d}=\frac{b+c}{a+b+c+d}\times\frac{c+d}{a+b+c+d} \\\iff &ac=bd.\end{align}

Imagine two events $X$ and $Y$ that are not mutually exclusive, such that $P(X) = 0.3 \,$ and $P(Y)=0.4.$ Consider their Venn diagram.

It should be clear that the only value of $P(X \cap Y)$ that makes $X$ and $Y$ independent is $P(X \cap Y) = 0.12.$

$$b=0.3-c\tag1$$$$d=0.4-c\tag2$$$$a=1-0.3-(0.4-c)=0.3+c\tag3$$

For events $X$ and $Y$ to be independent, $$ac=bd\tag4.$$

Solving $(1),(2),(3),(4)$ gives $$c=0.12,$$ as required.


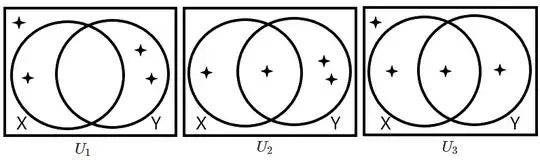
Independence of events is not straightforward to intuit from Venn diagrams (unlike mutual exclusivity, which is observed by inspecting their intersection).

For example: enter image description here

$$ \begin{array}{r} \begin{array}{c|c|c} \style{font-family:inherit}{} & \style{font-family:inherit}{U_1} & \style{font-family:inherit}{U_2} & \style{font-family:inherit}{U_3} \\\hline \style{font-family:inherit}{P(X\cap Y)} & 0 & \frac14 & \frac14 \\[0pt]\hline \style{font-family:inherit}{P(X)P(Y)} & \frac14\times\frac12=\frac18 & \frac14\times\frac34=\frac38 & \frac12\times\frac12=\frac14 \\[0pt]\hline \style{font-family:inherit}{\therefore X\text{ and }Y\text{ are}\ldots} & \textbf{dependent} & \textbf{dependent} & \textbf{independent} \end{array}\hskip-5.5pt \end{array} $$ [Universe $U_1$ above is also an example of the fact that for events with nonzero probabilities, $\big(\text{mutual exclusivity}\implies\text{dependence}\big)$.]

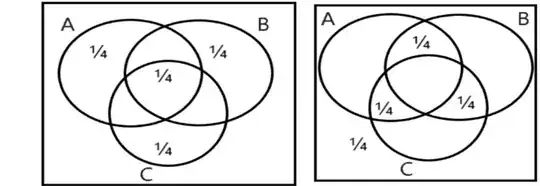
Two more examples, but involving $3$ events: in each case, events $A,B$ and $C$ are pairwise independent yet not (mutually) independent $\big($since $P(A \cap B\cap C) \neq P(A)P(B)P(C)\,\big):$ enter image description here


When the probability experiment has just $2$ trials, a table like this is a good way to understand/visualise conditional probability as working in a reduced sample space: $$ \begin{array}{r} \begin{array}{c|c|c} \style{font-family:inherit}{\text{time of complaint}\bigg\\ \text{reason for complaint}} & \style{font-family:inherit}{\textbf E\text{lectrical}} & \style{font-family:inherit}{\textbf M\text{echanical}} & \style{font-family:inherit}{\textbf L\text{ooks}} \\\hline \style{font-family:inherit}{\textbf D\text{uring guarantee period}} & 18\% & 13\% & 32\% \\[0pt]\hline \style{font-family:inherit}{\textbf A\text{fter guarantee period}} & 12\% & 22\% & 3\% \end{array}\hskip-5.5pt \end{array} $$ The calculation (notice that the figure ‘$32$’ was obtained from the intersection of column $L$ and row $D$) $$P(L|D)=\frac{P(L\cap D)}{P(D)}=\frac{32}{18+13+32}=51\%\neq32\%+3\%=P(L)$$ shows that $L$ and $D$ are dependent events.

ryang
  • 38,879
  • 14
  • 81
  • 179
0

click to see diagramThe accepted answer by @Stats Data Enthusiast is certainly relevant, but I beg to differ on the question of whether it is possible to represent independence with Venn diagrams. The crucial observation is to use the area of the Venn diagram to represent a product of two, linearly independent, measurable subspaces.

Let the universe of the Venn diagram be a unit square in the Cartesian plane, and let the unit intervals in the X and Y axes be probability spaces of their own. Just really skinny - lengths rather than areas. Then the unit square is the product of those two subspaces, and the area measure is the product measure.

The two events identified in the original question with probability .3 and .4 would be represented on each axis as a segment of length .3 on on the X-axis and .4 on the Y-axis. Within each respective unit interval, each event has the stated probability. Let each sub-interval begin at the origin, (0,0).

Next consider the regions formed by treating each sub-segment as the short side of a rectangle - a region within the unit square, whose long side is the adjacent unit interval on the other axis, from (0,0) to (0,1) or to (1,0) respectively. In the theory of product spaces these rectangles are called cylinders, because they have a subset on one side and a whole space as their other side. In a probability space, the whole has measure 1, so the area of a cylinder is numerically equal to the length of its short side.

Now it's easy to see that the intersection of these two rectangles (cylinders) is a smaller rectangle with area .3 * .4 = .12! So we have a perfect Venn diagram which demonstrates the independence of the two events. And meanwhile shows the relation between probabilistic independence and linear independence.