1

I'm solving a physics problem and I need to obtain the Fourier transform of the following real function ($a>0$):

\begin{equation} f(t) = \frac{|t|}{t^2 +a} \end{equation}

It is an even-function and therefore it can be decomposed into a cosine-integral, ie.

\begin{equation} f(t) = \int_{0}^{+\infty} a(\nu)\cos(2\pi\nu t)d\nu \end{equation}

with the coefficients being,

\begin{equation} a(\nu) = 2\int_{-\infty}^{+\infty} f(t)\cos(2\pi\nu t)dt \end{equation}

\begin{equation} a(\nu) = 2\int_{-\infty}^{+\infty} \frac{|t|}{t^2 +a}\cos(2\pi\nu t)dt \end{equation}

\begin{equation} a(\nu) = 4\int_{0}^{+\infty} \frac{t}{t^2 +a}\cos(2\pi\nu t)dt. \end{equation}

However, I have not been able to solve this. Wolfram also can't. I tried expanding the cosine term into a series, but then I get a series of diverging integrals.
  • 1
    I have tried to compute the hilbert transform of $exp(-|x|)$ on wolfram and it gives a result. Try to type “Hilbert transform exp(-abs(x))”. The Hilbert transform of a function $f$ essentially takes the fourier transform of $f$, multiplies it by the signum function, then anti fourier transforms back, see https://en.wikipedia.org/wiki/Hilbert_transform , third section. You should obtain what you want using the fact that the fourier transform of $exp(-|x|)$ is $1/(x^2+1)$ up to constants and using the properties of the fourier transform. I don’t know how to compute all of this explicitly though. – Lorenzo Pompili Sep 27 '21 at 09:52
  • 2
    $$e^{-|x|}=\frac{1}{\pi}\int_{\mathbb{R}} \frac{e^{-ixt}}{1+t^2},dt$$ Formal differentiation of $e^{-|x|}$ for $x\neq0$ gives something close to what you want. – Mittens Sep 27 '21 at 10:18

1 Answers1

2

Computer-aided I obtain the following transform:

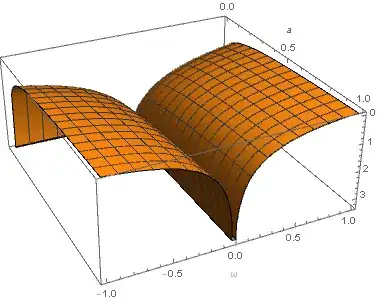
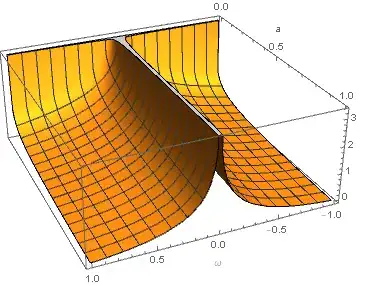
$$\frac{G_{1,3}^{2,1}\left(\frac{a \omega ^2}{4}| \begin{array}{c} 0 \\ 0,0,\frac{1}{2} \\ \end{array} \right)}{\sqrt{2}}$$

where $G$ is the MeijerG-Function. Here are two plots, where both variables $a$ and $\omega$ ran from $-1$ to $1$:

enter image description here enter image description here

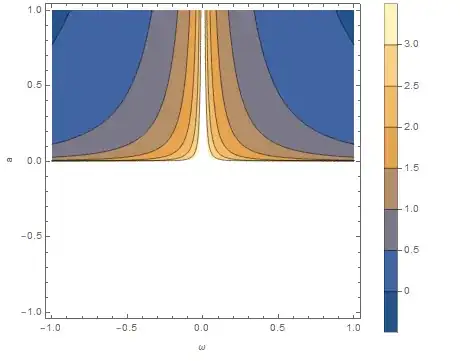
A contour plot, where $a$ and $\omega$ each ran from $-1$ to $1$ looks as follows:

enter image description here