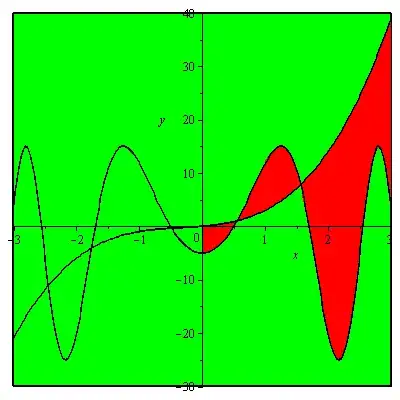
One way is to add a colored rectangle to the displayed items. Note that the filled red region now gets transparency=0.0 so that the green doesn't bleed through it.
a := x^3+x^2-x:
b := 20*sin(x^2)-5:

plots[display](
    plottools[transform]((x, y)-> [x, y+x^3+x^2+x])
        (plot(20*sin(x^2)-5-x^3-x^2-x,
        x = 0 .. 3, filled = true, color = red,
        transparency=0.0)),
    plot([x^3+x^2+x, 20*sin(x^2)-5],
         x = -3 .. 3, y = -30 .. 30, color = black),
    plottools:-rectangle([-3,-30],[3,40],colour=green));

And here is a version for those who will (often ill-advisedly) want to copy blocks of plaintext 1D Maple Notation code and paste it into a 2D Math input region.
H := plottools[transform](proc(x, y) [x, y+x^3+x^2+x]; end proc):
plots[display](H(plot(20*sin(x^2)-5-x^3-x^2-x,
        x = 0 .. 3, filled = true, color = red,
        transparency=0.0)),
    plot([x^3+x^2+x, 20*sin(x^2)-5],
         x = -3 .. 3, y = -30 .. 30, color = black),
    plottools:-rectangle([-3,-30],[3,40],colour=green));
The 2D Math parser doesn't like the first version above since the formatted code involves extra spaces between the transform result and its bracketed arguments. A space in such a function call gets parsed in 2D Math mode as an implicit multiplication. All these parsing issues have nothing in particular to do with this solution, or with background colors on plots, or with plots[display].


filled = true, color = redpart?filledequaling true means you have a background,color = redmeans this background has color red, changing that will change the background color. – Shuhao Cao Jun 13 '13 at 18:59