What is a good graphing program and code to graph $F(x)=\prod_{p \leq x} \frac{p-1}{p}$ where the product is taken over all primes $p \leq x$ and $x$ is an integer? I have been doing research on this an have come up with inconclusive results. I am mostly looking for something that is simple (online and does not need to be downloaded) but gets the job done. Nonetheless, if there is not such a program, please try to specify with Python, if possible.
-
The numerators of your $F(x)$ are in A076359, and denominators are in A076358. Btw, there is tag [tag:math-software]. – Vepir Sep 14 '20 at 16:07
2 Answers
I have few suggestions:
Wolfram Mathematica
Python (SymPy)
other recommended things
Mathematica
I use Wolfram Mathematica. It is not a free software, but you can use a free version of it online.
That is, you can write an online wolfram mathematica notebook and then click run (shift + enter).
Your function would be something like:
ListPlot[Table[Product[(Prime[i] - 1)/(Prime[i]), {i, 1, PrimePi[x]}], {x, 1, 1000}]]
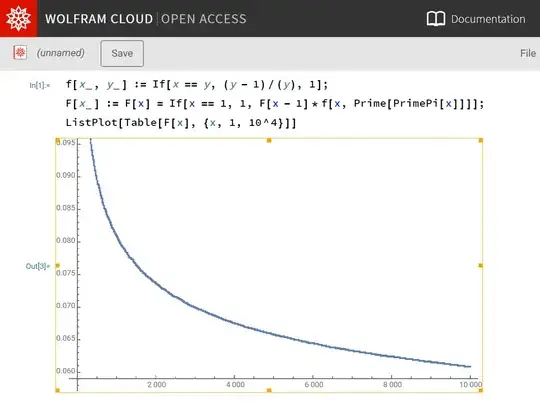
But the above code is slow because we are calculating every product from the beginning. Instead of being inefficient like above, we can write a recursive function that stores and uses previous values like so:
f[x_, y_] := If[x == y, (y - 1)/(y), 1];
F[x_] := F[x] = If[x == 1, 1, F[x - 1]*f[x, Prime[PrimePi[x]]]];
ListPlot[Table[F[x], {x, 1, 10^4}]]
Entering the new code into the above link I gave you, will give you:
You can also customize the ListPlot to look nice, and then export it as pdf or image.
There is mathematica.stackexchange.com for questions regarding this software. You might not even need to ask questions there, as the documentation is already very good and full of examples.
In the above example, F[x_] := ... is a function definition and F[x_] := F[x] = ... tells the function to remember (store) the values so it does not need to re-evaluate it every time you call it for the same x value. Note that if you change the definition of the function, the new values will not update over the old stored ones. You need to clear them by running ClearAll[F]; once, which removes the definition of the F and everything associated with it, such as the stored values F[x].
Python
If you want to stay inside python, look into SymPy (e.g. SymPy's number theory) and matplotlib.
Equivalent code to the above code:
from sympy import primepi
from sympy import sieve
import matplotlib.pyplot as plt
limit = 10**4
sieve.extend(limit)
def f(x,y):
    if x == y:
        return (y-1)/y
    return 1
F = [1]
for x in range(2, limit):
    F.append(F[-1]*f(x, sieve[primepi(x)]))
plt.axis([None, None, 0.059, 0.0975])
plt.plot(F)
plt.show()
Produces an equivalent image:
Where notice that the Mathematica automatically restricted the y-axis to make the plot look "pretty" (in the previous image),
where in python I added plt.axis([None, None, 0.059, 0.0975]) to achieve the same effect here. (Though, it looks like here x-axis is a bit shorter - but anything can be customized in both codes if you want, just explore the documentation.)
Alternatives
For alternatives, check similar questions already asked here, such as:
- 12,516
I suggest PARI/GP in a browser. Use this code
F(x)=prod(n=1,primepi(x),1-1/prime(n));
plot(x=10,200,F(x))
to define and plot your function. If you run the
program locally with graphics enabled you can replace
plot with ploth to get a high resolution plot.
This can be saved in a graphics format such as PDF.
- 35,251
- 3
- 30
- 76

