8

I tried asking this in electronics as a question related to oscillators, but I wasn't able to get a satisfactory answer. I think the more math-y types here may shed some additional light on the phenomenon I am observing.

I am using two clocks (measured-clock and reference-clock) to measure the time of one relative to the other. I plot the accumulated difference between the clocks (in microseconds) vs. the total time elapsed on the reference-clock (in seconds). After collecting an hours' worth of data, I can perform a linear regression to determine the difference in frequency between the clocks.

The linear regression has $r^2 = 0.9999$, so it's about as perfect as you can get. The slope of the line is, for example, $-36.3$. This implies that for every second of reference-clock time, the measured-clock falls 36.3 microseconds behind.

I then tune the measured-clock so that it has an extra 36.3 microseconds per second. I then re-run my analysis, expecting a very flat slope and poor $r^2$. Instead, I get another $r^2 = 0.9999$, with a slope of about $-1.2$. If I adjust for an additional 1.2 us/s (bringing the total to 37.5 us/s), I then get the satisfactory "flat slope and poor $r^2$".

It appears as if the first linear regression was wrong, despite the perfect $r^2$. Iteratively calculating linear regressions while $r^2$ is very high will arrive at the correct answer, so it seems as if there is some systemic error that I am unaware of. What am I doing wrong?

EDIT:

My initial clock frequency estimate is 14,318,180 Hz (the HPET timer). From iterative regressions, I can determine that the real clock frequency should be 14,318,712 Hz. This is an additional 532 ticks per second, which implies that the actual error is $-37.156$ us/s.

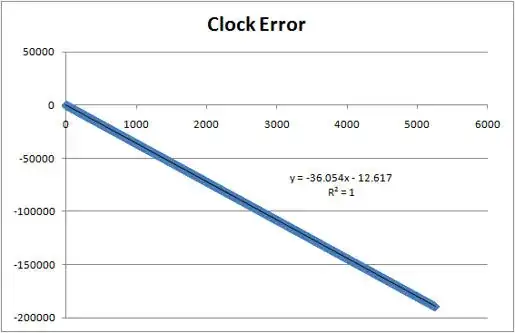
Here is the initial regression. The X axis is the elapsed time of the reference clock, in seconds. The Y axis is the difference between the elapsed time on the measured clock and the elapsed time on the reference clock, in microseconds (i.e. the error between the two clocks as a function of the elapsed time on the reference clock). The reference clock is precise, but not accurate, however I want to match any inaccuracy in the reference clock so that's okay.

Here is a plot of the residuals for that regression.

The initial regression suggests an error of $-36.054$ us/s. This is an additional 516 ticks per second, suggesting that my HPET is really $14,318,696$ Hz. As mentioned above, however, this value is not correct.

ajs410
  • 181
  • What variables is the linear regression relating? You might have them in the wrong order. – Qiaochu Yuan May 04 '11 at 19:29
  • Having a Pearson correlation coefficient near 1 isn't always a guarantee for linear behavior; it only says that linear behavior is "very likely". Did you remember to plot residuals? – J. M. ain't a mathematician May 04 '11 at 19:32
  • I have updated the question with plots of the regression and residuals. – ajs410 May 04 '11 at 20:51
  • Ah, you see the curving up in your residuals? That's what Ralph was alluding to in his answer. – J. M. ain't a mathematician May 04 '11 at 20:52
  • I believe the curving that you allude to is subtle (like 0.05 PPM) changes in the test oscillator's frequency. The curve is not a pure U, but more of a wavey W. – ajs410 May 04 '11 at 20:56
  • If necessary, you could cut the analysis short at the 3000 second mark. The result is still the same; -36 us/s regression, and the remaining residuals would not have any curvy shape, though they would resemble a slowly increasing line – ajs410 May 04 '11 at 21:04
  • Where you wrote "us/s", did you mean "$\mu s/s$"? – Michael Hardy Feb 12 '13 at 17:22

1 Answers1

3

You are violating the independence assumption of linear regression. Your observations are correlated with each other. You cannot use standard linear regression.

  • I'm not sure how they're correlated? They are two independently free-running oscillators. If standard linear regression is not correct, then what analysis should I run instead? – ajs410 May 04 '11 at 20:54
  • 1
    @ajs - The problem is not the correlation between the oscillators. It is an autocorrellation problem within the data. If I pick any two people born in 2000 and correlate their weights with each other for each year 2000-2011, there is most likely going to be a significant correlation. – Ralph Winters May 05 '11 at 12:57
  • Okay, even if I ignore linear regression and instead choose to use a point-slope calculation, the result I get is still erroneous. And yet the relationship is pretty clearly linear, because once I know the "right" slope everything works fine. But the techniques I'm using do not give me the right slope on the first try. – ajs410 May 05 '11 at 20:52
  • If errors are correlated and their covariance matrix is $\sigma^2 V$ where $V$ is a known matrix and $\sigma>0$ must be estimated based on the data, then instead of minimizing $|\hat\varepsilon|^2$, the sum of squares of residuals, one should minimize $\hat\varepsilon^T V^{-1}\hat\varepsilon$ where $\hat\varepsilon$ is the vector of residuals. – Michael Hardy Feb 12 '13 at 17:25