I'm interested in the behaviour of applying the same function repeatedly or oscillating between applying two different functions repeatedly. Let me explain.
If I wanted to know what happens when I square $x$ repeatedly, i.e.: $${{\left({\left({\left(x^2\right)}^2\right)}^2\right)}^2}^{...}$$ I know that this is essentially $$x^{2^{n}},\qquad n=1,2,3,...$$ So I know that if I was to graph $f(x)=x^{2^{4}}$ I'd be graphing what happens if I square $x$ four times.
Similarly, if I wanted to oscillate between squaring and cubing, as in $${{\left({\left({\left(x^2\right)}^3\right)}^2\right)}^3}^{...}$$ then I would find that this is essentially $$x^{\frac{1}{2}\bigl(3-\left(-1\right)^n\bigr)\times6^{\lfloor\frac{n}{2}\rfloor}},\qquad n=1,2,3,...$$ (I had to look up the sequence of numbers, $2,6,12,36,72,...$ that results from $2\times3\times2\times3\,...$ to find a function that would work here). I know that for this if I input $n=3$ I've squared, then cubed, then squared again.
I realise that the examples so far are fairly identical, always producing graphs of $x$ to a positive even number so that as $n\to\infty$ they are the same square bottomed curve in the positive $f(x)$ portion of the plane. However, what I'm more interested in would be repeating a function like $$\sin(\sin(\sin(...\sin(\sin(x))...)))$$ or something which oscillates like $$\sin(\cos(\sin(\cos(...\sin(\cos(x))...))))$$ which can be denoted as $f(x)=\sin(\cos(x))$ and then adopt the iteration notation of $f^{\,n}(x)$ where $f^{\,2}(x)=f(f(x))$ and so on with $n\to\infty$
Can these be written in a simpler form?
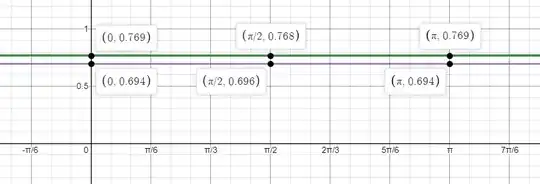
I plotted the oscillating version of this repeated function for starting with $\mathrm{sine}$ or starting with $\mathrm{cosine}$ for several iterations and obtained the following results:

 As you cans see, after several iterations they are barely sinusoidal in nature at all and are closer to a straight line parallel to the $x$-axis, although there's barely just still some peaks and troughs (some have been highlighted). Is there any reason why they seem to approximate two numbers, namely $y\approx0.695$ for the purple graph and $y\approx0.768$ for the green graph? Is it possible to know these numbers exactly if we could perform the oscillation of functions many many times and solve?