I have seen the batman curve before (asked about here: Is this Batman equation for real?), but this method seems fairly limited in what you can draw. What are some other ways that you can draw shapes and images throught equations?
Asked
Active
Viewed 4,765 times
0
-
You can use Fourier series: https://www.youtube.com/watch?v=-qgreAUpPwM – Hans Lundmark Dec 03 '19 at 08:10
1 Answers
1
As with computer graphics, there are two main paths you can go: either pixel graphics or vector graphics. Now the former of the two is, in my opinion, easier to write an equation for, so I'll talk about that one here (though if people are interested I can share the formulas for vector graphics)
First, lets figure out how to draw a rectangle. A rectangle has the trait of its absolute value being less than $l_x$ on the x axis and less than $l_y$ on the y axis. By this I mean that these two things are true $|x|<l_x,|y|<l_y$. Here's the equation I wrote to check if both of these conditions are met: $\lfloor{|x|}\rfloor+\lfloor|y|\rfloor=0$. This works because if both x and y are less than one in absolute value then the floor of them is zero. This is how desmos graphs the function:
 One thing to note is that desmos actually graphs it a little incorrectly, since it should fill in the entire rectangle, since every value between -1 and 1 should solve this function in both x and y. To fix this problem, if your using desmos, is to rewrite the function as inequality $\lfloor(|x|)\rfloor + \lfloor(|y|)\rfloor\leq1$ which will make your rectangle fully filled in. We can translate and strech by rewriting the equation like this: $\lfloor|\frac{1}{5}(x-3)|\rfloor+\lfloor|\frac{1}{3}(y-2)|\rfloor$. This is a rectangle centered at (3,2) that is 5 wide and 3 long.
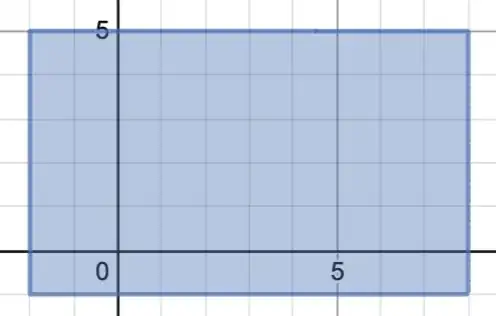
In general, the equation looks like this $$R(x,y,c_x,c_y,s_x,s_y)=\lfloor|\frac{1}{s_x}(x-c_x)|\rfloor + \lfloor|\frac{1}{s_y}(y-c_y)|\rfloor $$
The next step is combine the rectangles, which will function as pixels to the image. We want to additively combine them, so that if two rectangle overlap then they don't cancel out. Since these rectangle are equal to zero in the area that shoudl be colored in, we just multiply them together, because if any of the rectangles are zero, the entire equation will become zero. For example this equation $R(x,y,3,3,2,2)\times R(x,y,10,5,4,3)\times R(x,y,4,-5,2,2)\leq 1$ results in a graph that looks like this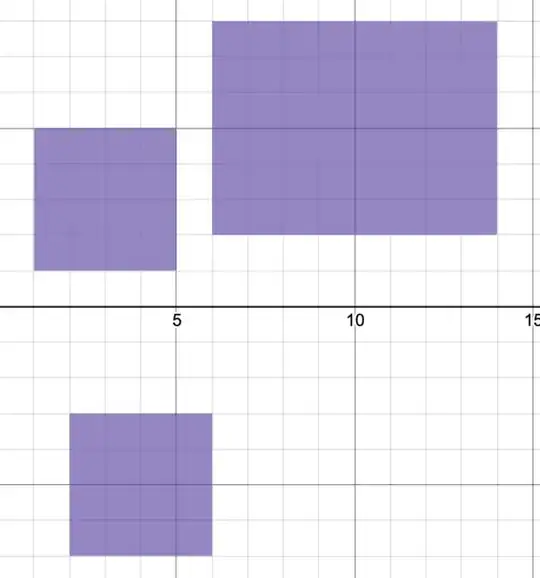 .
This gives us all kinds of power to draw things. For example, we can draw parametric equations, like this $$\prod_{n=0}^{9\cdot2\pi}R\left(x,y,5\cdot\cos\left(\frac{n}{2\cdot3}\right),\sin\left(\frac{n}{3\cdot3}\right)\cdot5,\frac{1}{2},\frac{1}{2}\right)\le1$$ to get this:
.
This gives us all kinds of power to draw things. For example, we can draw parametric equations, like this $$\prod_{n=0}^{9\cdot2\pi}R\left(x,y,5\cdot\cos\left(\frac{n}{2\cdot3}\right),\sin\left(\frac{n}{3\cdot3}\right)\cdot5,\frac{1}{2},\frac{1}{2}\right)\le1$$ to get this:
 .
.
Now to make this work on images, we need to do a little bit of programming. Lets first choose an image, ideally one which has well defined edges. I'm going to use this picture

What we're going to do with this program is to mark where we want to draw our rectangles by reading the pixels of the image into black and white and then deciding whether an area is dark enough to draw. Heres the program that I wrote:
import java.awt.image.BufferedImage;
import java.io.*;
import java.awt.*;
import javax.imageio.ImageIO;
import javax.swing.*;
import java.awt.image.WritableRaster;
class img2Func {
    public static void main(String[] args) {

        BufferedImage image = resize(loadImage("images.png"),100,100);
        WritableRaster raster = image.getRaster();
        int tmp = 0;
        int width = image.getWidth();
        int height = image.getHeight();
        int[] pixels = new int[width*height];
        for( int j = 0; j < height; j++ ){
            for( int i = 0; i < width; i++ ) {
                Color c = (new Color(image.getRGB( i, j )));
                pixels[tmp++] = ( c.getRed()*.3 + c.getGreen()*.59 + .11*c.getBlue()) > 355/2?1:0;
                //( (0.3 * R) + (0.59 * G) + (0.11 * B) ).
            }
        }
        System.out.println();
        System.out.print("L=[");
        for (int i = 0; pixels.length > i; i++) {
            if(pixels[i] !=1) {
                System.out.print(i+",");
            }
        }
        System.out.print("]");


    }


public static BufferedImage resize(BufferedImage img, int newW, int newH) {
    Image tmp = img.getScaledInstance(newW, newH, Image.SCALE_SMOOTH);
    BufferedImage dimg = new BufferedImage(newW, newH, BufferedImage.TYPE_INT_RGB);

    Graphics2D g2d = dimg.createGraphics();
    g2d.drawImage(tmp, 0, 0, null);
    g2d.dispose();

    return dimg;
    }
    static BufferedImage loadImage(String loc) {
        try {
        BufferedImage img = ImageIO.read(skyblock.class.getResource(loc));

        return img;
    }
    catch(Exception e) {
        e.printStackTrace();
    }
    return null;


    }

}
This program finds all elements that dark enough and prints the location of those pixels. It will print out a bunch of numbers, and we can use these numbers to graph (don't forget to remove the trailing "," otherwise desmos will be confused) the image. Here are the final formuales.
$$L=[122,123,136,137,...]$$
$$\prod_{n=1}^{L.\operatorname{length}}R\left(x,y,2\cdot\operatorname{mod}\left(L\left[n\right],w_{idth}\right),2\cdot\left(w_{idth}-\operatorname{floor}\left(\frac{L\left[n\right]}{w_{idth}}\right)\right),1,1\right)\le1$$
This does often run slowly on desmos though, so you can split the formula into different parts, here is what my graph looks like on desmos.  .
.
Caleb Briggs
- 1,083