my question is somewhat related to this one here, where the expected value of the distance $d$ of two uniformly drawn points from an interval $[0;L]$ is sought. It's $\frac{L}{3}$ and the pdf should be $f(d)=\frac{2}{L^2}(L-d)$ if I'm not mistaken.
Now imagine we're drawing $N+1$ points from the interval and designate one as the reference $y$. I'd like to know how the average distance to $y$ is distributed, i.e. $\frac{1}{N}\sum|x_n-y|=\frac{1}{N}\sum{d_n}\sim\;?$
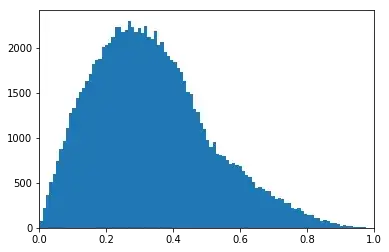
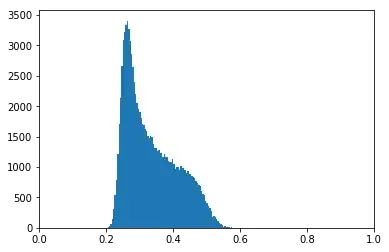
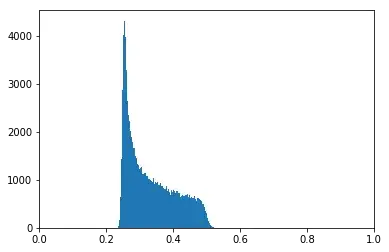
For $N=1$ we have the situation from above, but for larger $N$ I don't know how to derive this because the pdf's of the individual distances are not independent. Is it even possible to get an analytic formulation? I looked at some histograms for different $N$ and how they seem to be "evolving" in a non-trivial manner ($N=[1,2,10,100,1000]$)
Any help in understanding this behaviour is much appreciated!


