I have 24 values for $Y$ and corresponding 24 values for $t$. The Y values are measured experimentally, while t has values $t=1,2,\dots 24$.
I want to find the relationship between Y and t as an equation using Fourier analysis.
I wrote the following MATLAB code:
Y=[10.6534
9.6646
8.7137
8.2863
8.2863
8.7137
9.0000
9.5726
11.0000
12.7137
13.4274
13.2863
13.0000
12.7137
12.5726
13.5726
15.7137
17.4274
18.0000
18.0000
17.4274
15.7137
14.0297
12.4345];
ts=1; % step
t=1:ts:24; % the period is 24
f=[-length(t)/2:length(t)/2-1]/(length(t)*ts); % computing frequency interval
M=abs(fftshift(fft(Y)));
figure;plot(f,M,'LineWidth',1.5);
grid % plot of harmonic components
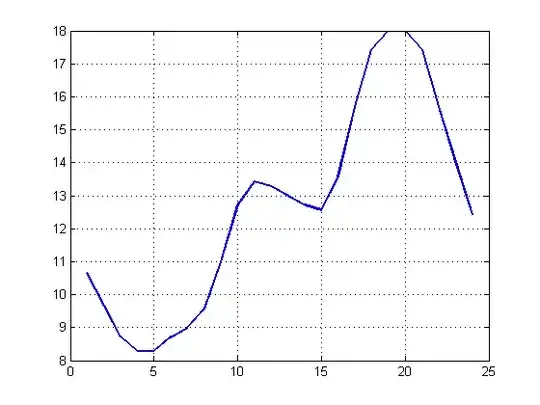
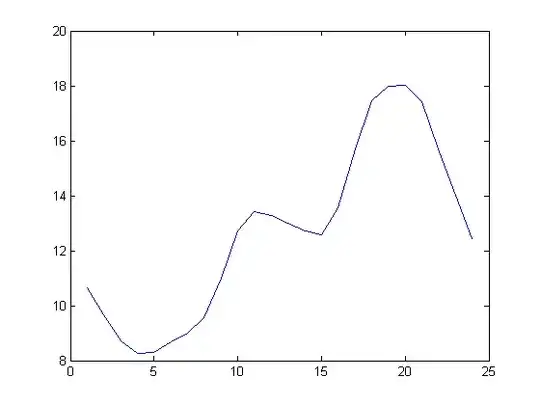
figure; plot(t,Y,'LineWidth',1.5);
grid % plot of original data Y
figure; bar(f,M); grid % plot of harmonic components as bar shape
the results of the bar figure was and now is:
Now, I want to find the equation for these harmonic components which represent the data. After that I want to draw the original data Y with the data found from the fitting function and the two curves should be close to each other.
Should I use cos or sin or -sin or -cos? In other words, what is the rule to represent these harmonics as a function: $Y = f ( t )$ ?