Minimum of Sequence
Define $L(n)$ as the limit of the sequence $f_{i+1}=n^{-f_i}$, given $f_0=x$. We may show that $L(n)$ is strictly decreasing over $[e^{-1/e},e^e]$. But this is the only interval where $L(n)$ is convergent. Hence, the minimum of $L(n)$ is at $e^e$. However, for $n>e^e$, the sequence oscillates between two values near $0$ and $1$. In fact, the oscillating sequences have no minimum and can be made arbitrarily close to $0$, for odd $i$.
Assuming convergence, we may solve $L(n)=n^{L(n)}$ for $L(n)=\frac{W(\ln n)}{\ln n}$, where $W(x)$ is a branch of the Lambert $W$ function. And indeed, at $n=14$, we have $\frac{W(\ln 14)}{\ln 14}\approx0.37$, as you'd suggested. For the oscillating sequences, the larger we make $n$, the smaller we can make the lower limit of this sequence (i.e. the limit of the odd terms) (code).
Addenda
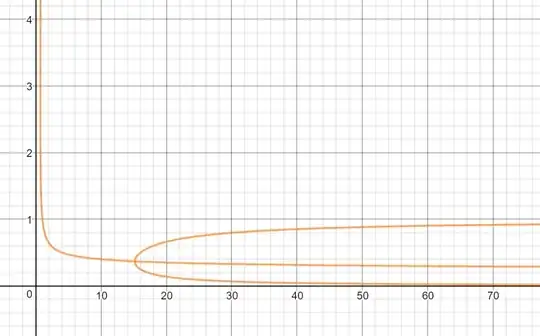
Assuming the sequence is convergent, its limit as $i\to+\infty$ is $L=\lim_{i\to+\infty}x_{i+2}=\lim_{i\to+\infty}x_{i}$ *. Hence, $L=n^{-(n^{-L})}$, which allows us to plot $L$ vs. $n$, as in the figure below (desmos). This allows us to see the fork around $n=e^e\approx15.15$ between the upper ($L\approx1$) and lower ($L\approx0$) subsequences.
I've also noticed that for the oscillating sequences ($n>e^e$), if the starting value is $x>\frac{W(\ln n)}{\ln n}$ the sequence (for odd $i$) seems to converge to the upper value $(L\approx1)$, while for $x<\frac{W(\ln n)}{\ln n}$, the sequence (for odd $i$) seems to converge to the lower value $(L\approx0)$.
* It is more useful to compare $x_{i+2}$ and $x_i$ than $x_{i+1}$, as it lets us show the oscillatory activity for $n>15$.
