Possible Duplicate:
Distribution of the digits of Pi
If we plot the digits of $\pi$
$3.1415926535897932384626433832795028841971693993751058\cdots$
versus the indices
$((1, 3), (2, 1), (3, 4), (4, 1), \cdots)$
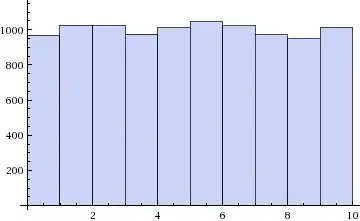
How to quantify the randomness of the resultant curve?
The first part of the curve looks like this .
Re: @Henning Makholm
Rephrasing the question, suppose the curve happens to be a sample function of a random process, how to give the distribution of that random process?